Sources
The sources tab of a pipeline card is where you tell duck soup what data to read, and which of it the pipeline starts from.
Adding a source
There are three ways to add one:
Drop files onto the Drag & drop spatial files here area (or click it to pick files). The files are uploaded to the server's temp folder (the drop area shows a spinner and which file it's on) and a source card is created for each, with the format detected from the extension.
- A Shapefile is uploaded together with its sidecar files (
.shx,.dbf,.prj, …) and becomes one source. - A File Geodatabase: drop the whole
.gdbfolder. It's uploaded file by file and becomes onefgdbsource.
Click a format button (GPKG, OAPIF, GeoJSON, WFS, FlatGeobuf, Parquet, Postgres, CSV, Excel, JSON, FileGDB, Shapefile, ArcGIS REST) to add an empty card preset to that format, then fill in the path or URL.
The add button adds a blank source card.
Uploading vs. pointing at files
Dropped files are copied to a temporary folder, which is fine for exploring. For a pipeline
you'll run again, point the uri at the file where it lives instead (type the path or use
the folder button). A source can point at any absolute path on disk.
The file browser
The folder button next to a source's uri (and next to the output file and a codelist's CSV file) opens a file browser on the server's file system:
- Places on the left jump to the project folder, its
data/,pipelines/andoutput/subfolders, your home folder, and each drive. - The path bar shows where you are. Click a folder in it to go up, or click the bar (or press Ctrl+L) to type or paste a path.
- Search (Ctrl+F) filters the current folder as you type. From two letters on, it also searches every subfolder below it.
- The filter shows only data files by default. Switch it to all files to see everything. Click a column header to sort by name, type, size or date.
- Click to select, double-click (or Enter) to open a folder or pick a file. A
.gdbfolder is picked like a file. Alt+←/→ go back and forward.
The browser remembers the last folder you used. It shows the machine the server runs on: in Docker, that's the container, so only mounted folders are visible.
The source card
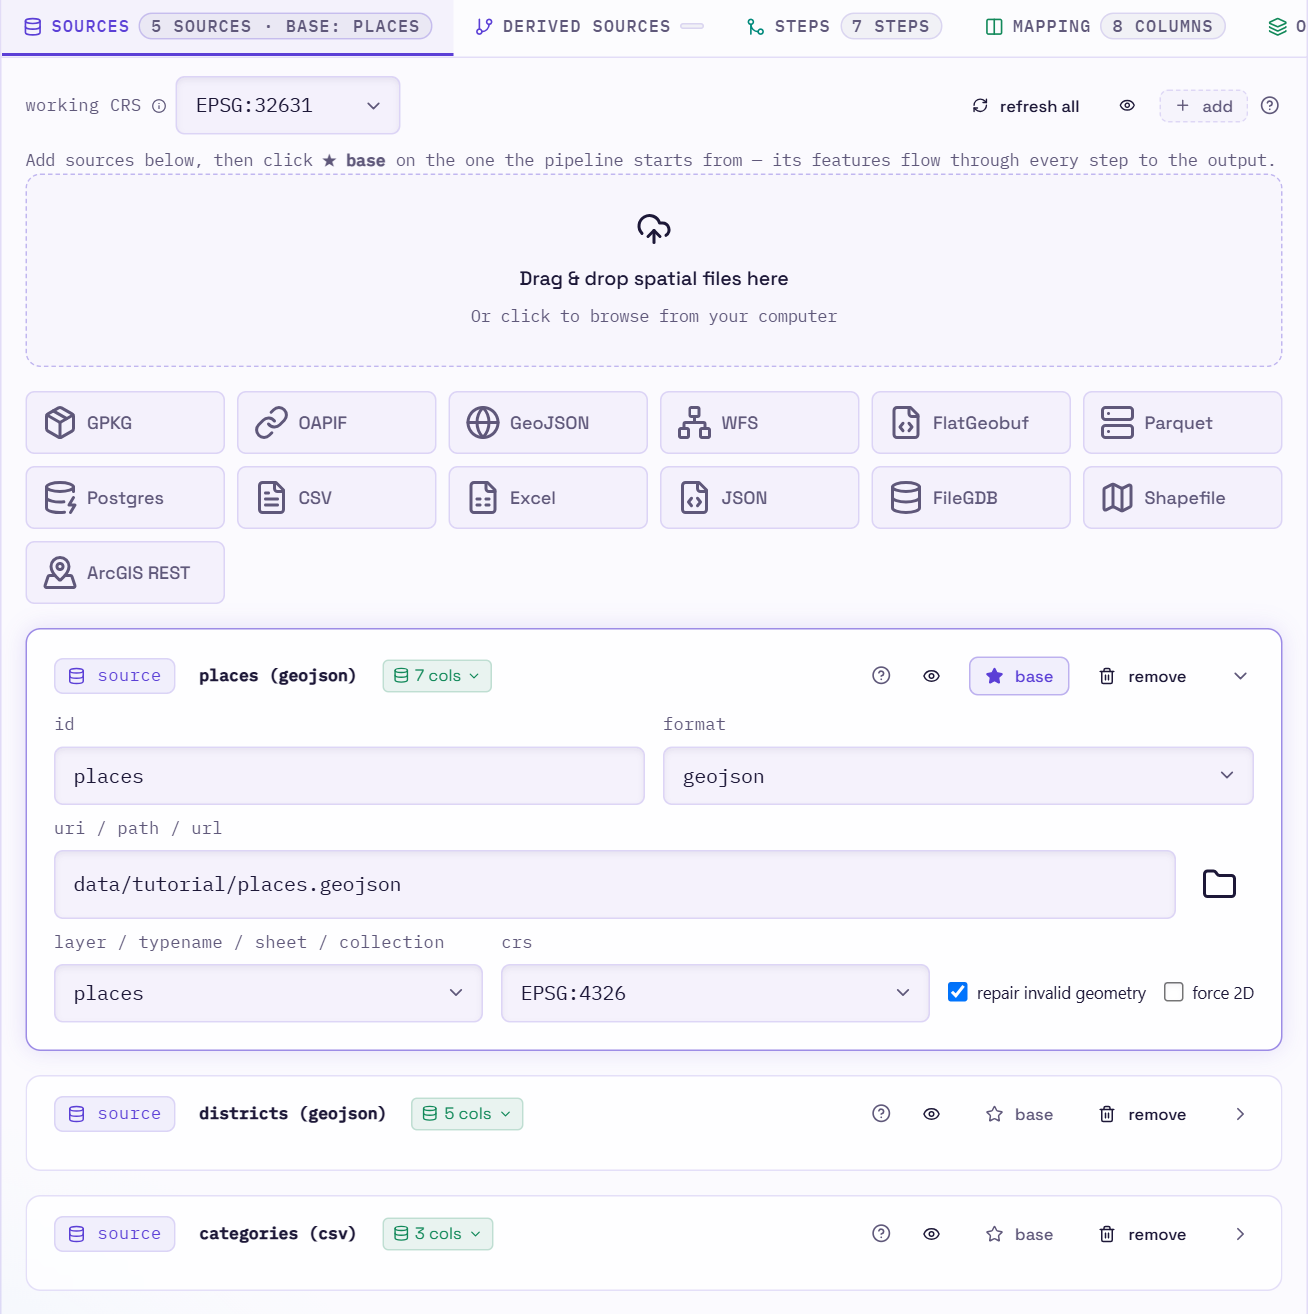
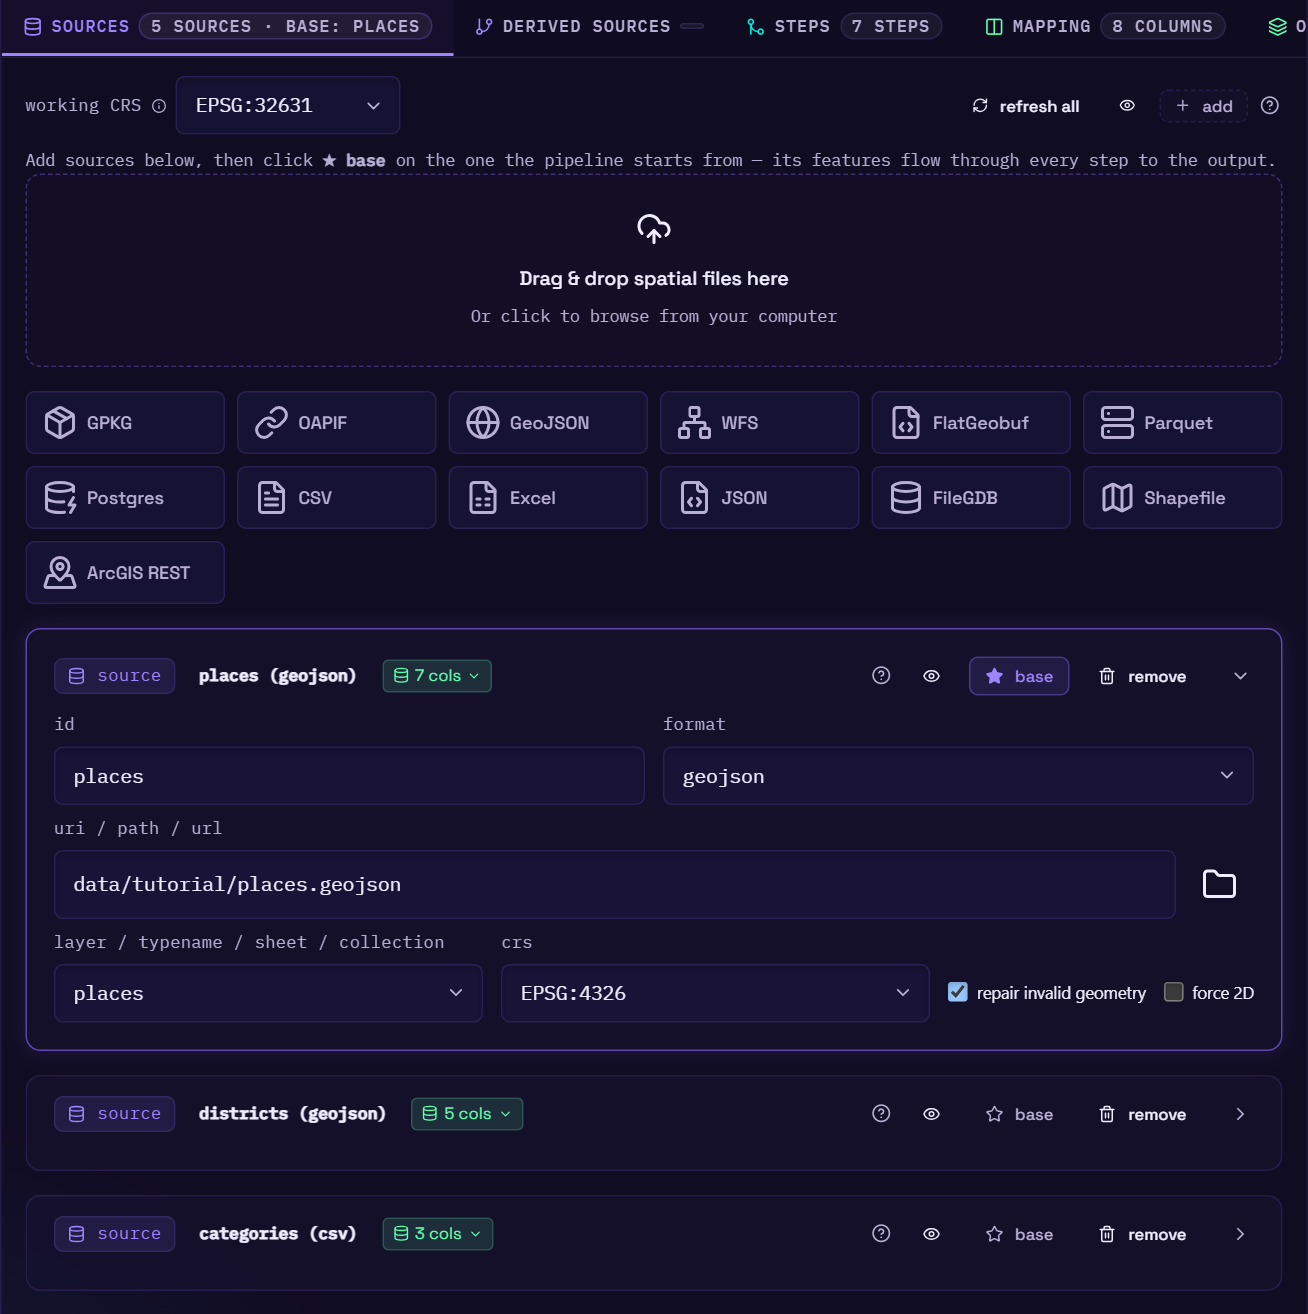
| Field | Notes |
|---|---|
| id | Your handle for the source, used by base, steps and derived sources. |
| format | Detected from the file extension when possible (marked from extension). |
| uri / path / url | A file path, a .gdb folder, a service URL or a Postgres connection string. The folder button opens the file browser at the current file's folder (or the project folder). |
| layer / typename / sheet / collection | Filled with the layers, feature types, sheets, collections or tables found in the source. Pick one. |
| crs | Detected from the data where possible (marked detected). Searchable list of common EPSG codes. |
| repair invalid geometry | make_valid: on by default. |
| force 2D | force_2d: drop Z (height) and M values on load. Off by default. See 3D geometry. |
Once the uri and layer are set, the editor inspects the source. It shows a badge with the column count and lists the columns and their types at the bottom of the card. Those columns then appear in the step and mapping pickers.
The card also shows warnings when something looks off:
- CRS sanity check: if the sampled coordinates don't fit the CRS you picked (for example, UTM-sized numbers declared as EPSG:4326), the card says so. A wrong CRS is the most common cause of empty spatial joins.
- Large-file note: on Windows, files over 2 GiB are read through
pyogrioinstead of DuckDB'sST_Readto avoid a crash. The card tells you when that happens. - Incomplete card: a card with no
idoruriis left out of the YAML, and the warning says why.
Service and database sources
- ArcGIS REST: set the uri to the service root (
…/MapServeror…/FeatureServer) and pick the sublayer. If you paste a URL ending in a sublayer id (…/FeatureServer/3), the editor splits it for you. - OGC API - Features: set the uri to the API root. If you paste a full
/collections/{id}/itemsURL, the editor trims it and fills in the collection. - WFS: the editor reads
GetCapabilitiesand lists the feature types. - Postgres: set the uri to a connection string
(
postgresql://user:pass@host:5432/dbname) and pick the table.
CSV, Excel and JSON
Tabular sources get extra controls:
- header row (CSV and Excel): auto-detect, first row is headers, or no header row.
- records path (JSON): where the array of records sits in the document, e.g.
data.items. Leave it empty when the file is the array itself. - geometry: none (tabular only), point from X / Y columns, or WKT / WKB / GeoJSON
column. When a column has an obvious name (
wkt,geom,geometry,lon/lat,x/y…) the editor pre-selects it and marks it detected. It does that only for a source you're adding and until you pick a mode yourself; a source loaded from a config keeps the geometry the config gives it, none included.
A dropped .json file is set up as GeoJSON. Switch the format to json if it holds plain
records instead. See JSON.
Downloads and large files
A source with an http(s):// URL is downloaded first, and a CSV or Excel file of 5 MB or more
is converted to Parquet once so previews stay fast. Both run in the background. While they do,
the card's badge shows the progress in place of inspecting…:
- downloading… 23.4 MB · 4.1 MB/s, or with a percentage when the server sends the file size.
- converting to Parquet for fast previews… 12 s.
The status at the top of the editor shows the same while a preview waits on the source, or lists them all when several are pending, e.g. 2 sources: roads 23.4 MB · sightings converting.
Once it's done, the card shows when the file was downloaded, e.g. Downloaded 2 h ago · 44.6 MB · read via Parquet. Previews keep using that download, even after you restart the editor, until you click refresh next to it, which downloads the file again in the background and then re-runs the preview. Run downloads fresh data, unless you tick reuse downloads from the last hour. See Remote files.
Refreshing all sources
Refresh all, in the tab's toolbar, reads every source of the pipeline again and then re-runs the preview. A downloaded file is downloaded again, as its own refresh does. Any other source has its columns and layers read again: previews always read a local file as it is on disk, but a source card only lists the columns it found when the card was loaded or last changed, so after a file is replaced with one that has other columns, the column pickers would still offer the old ones.
Choosing the base
Click ★ base on the source the pipeline should start from. Its features are the rows that flow through every step to the output. Exactly one source per pipeline is the base. The eye button in the tab's toolbar previews the base source before any steps.
The working CRS
The working CRS field at the top of the tab sets the CRS that every join, buffer and area/length calculation runs in. Pick it from the same searchable list as a source's CRS, or type any code. Leave it blank to use the base source's CRS. If you buffer, measure or use nearest-neighbour distances, set it to a projected CRS in metres. See Core concepts.
Derived sources
The derived sources tab holds filtered or buffered views of an existing source. Each card has:
- id: the new name.
- from: the source (or another derived source) to start from.
- where: optional: only the rows that match, e.g. vibe is chill. Pick conditions as column · operator · value rows, or write SQL with the <> button.
- buffer distance: optional, in working-CRS units.
- repair invalid geometry: on by default.
A derived source can be used anywhere a step asks for a source. Use one when you want to join
against only part of a big reference layer, or against a buffered version of it, without adding
steps to the main chain.
Previewing a source on its own
Click the eye button on a source card to see that source's raw features (no steps, no mapping) on the map and in the table. The card is highlighted while you preview it. The view dropdown in the map toolbar does the same, and lists every source. Pick pipeline output there, or click Show pipeline output above the table, to go back.