Preview, validate & run
Once a pipeline is built, this page covers checking it as you go, finding what's wrong, and saving and running it.
Automatic validation and preview
You don't need to click anything to see your work. About a quarter of a second after each change, the editor:
- validates the config against the same schema the CLI uses. The status indicator turns
validor shows the error. - if it's valid, previews it. The map and the Data Table show the first rows of the current pipeline's output.
On a slow pipeline a preview can take a while. After a second the status shows
previewing… 8s, counting up, until the preview is done. Once the query has run for a couple
of seconds it also says how far it is: previewing… 42% · 8s, in full at the top of the
preview panel, with the bar above the tabs filling up. A change made in the meantime replaces
the preview: the running one is stopped and only the newest one is computed, so a burst of
edits costs one preview, not one per edit.
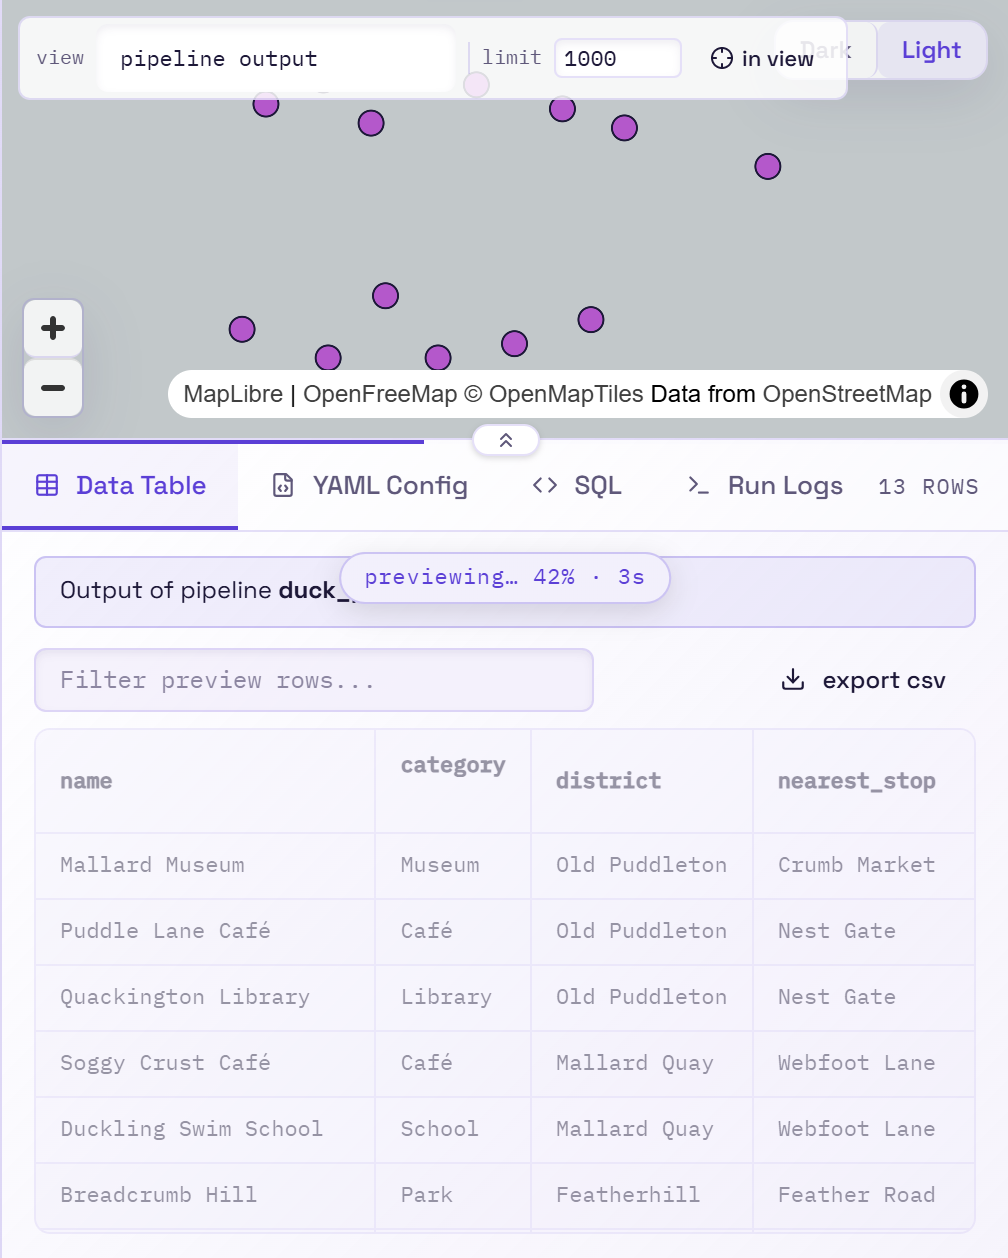
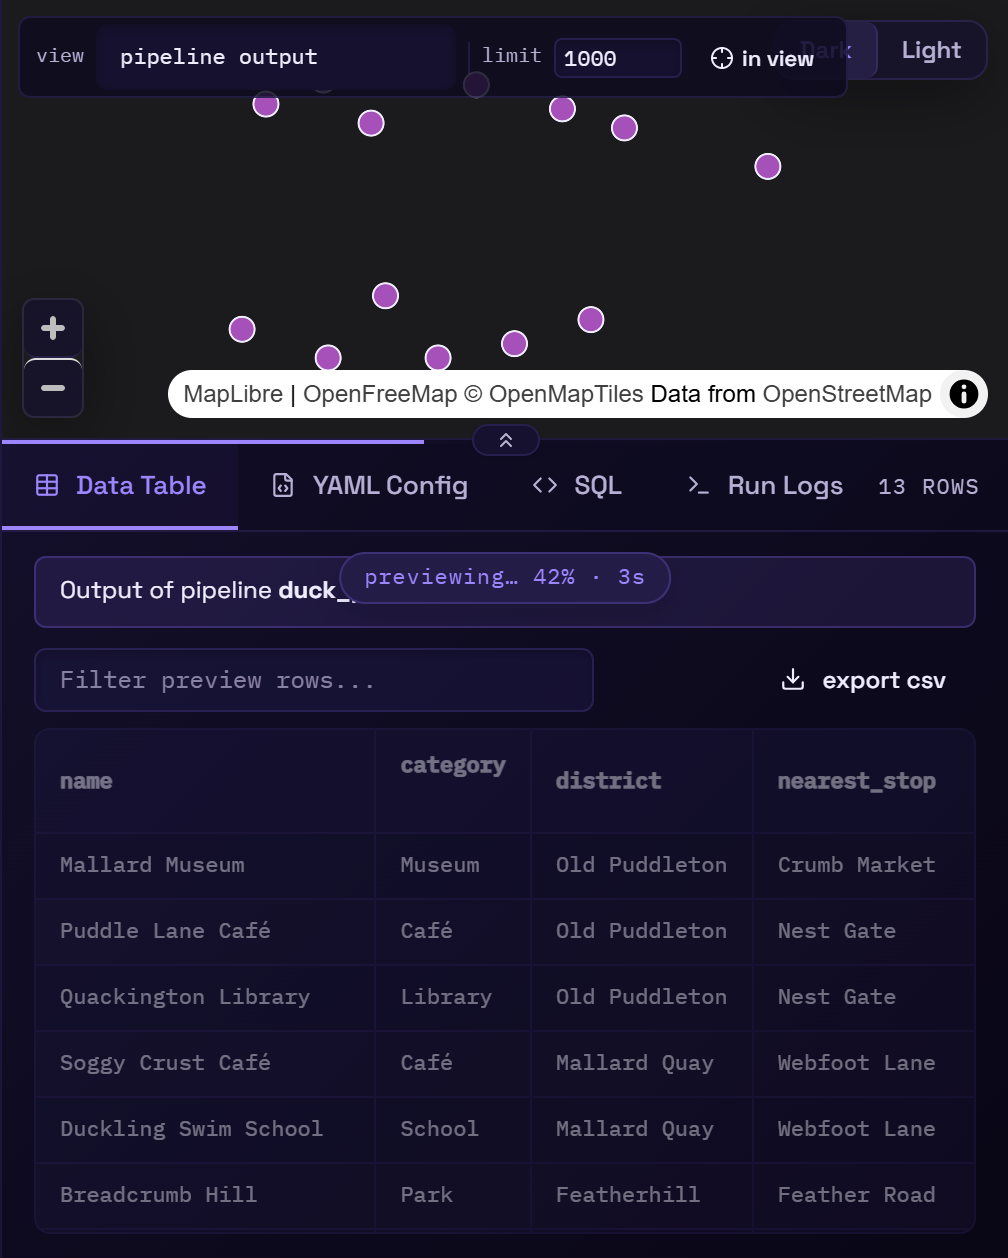
A run shows the same while it's going (running… query 42% · 63s). It computes each step and
writes each layer in a query of its own, and the percentage starts over for each.
The percentage is DuckDB's, and DuckDB doesn't track every query: whether it does is settled as the query starts, and now and then it doesn't. For such a query only the seconds show.
Validation checks the config's structure, not the SQL inside it. A mapping expression that
doesn't parse, or a column that doesn't exist, shows up when the preview runs, as an error
naming the mapping row, e.g. mapping 'width' (expr): Parser Error: syntax error at end of
input. These appear within a second, before any step is computed. An error that only
happens while computing values, such as a failed cast, appears once the steps have run.
The preview follows whichever pipeline card you're working in. Steps and sources can also be previewed on their own:
| To see… | Do this |
|---|---|
| the final output (mapping applied) | the default; or pick pipeline output in the map's view dropdown |
| one source, raw | pick it in the view dropdown |
| the base before any steps | the eye button in the sources tab |
| the rows after a given step | the eye button on that step card |
| the rows a step rejects | its red rejects node in the pipeline flow |
A banner above the table says what you're looking at, with a Show pipeline output button to go back.
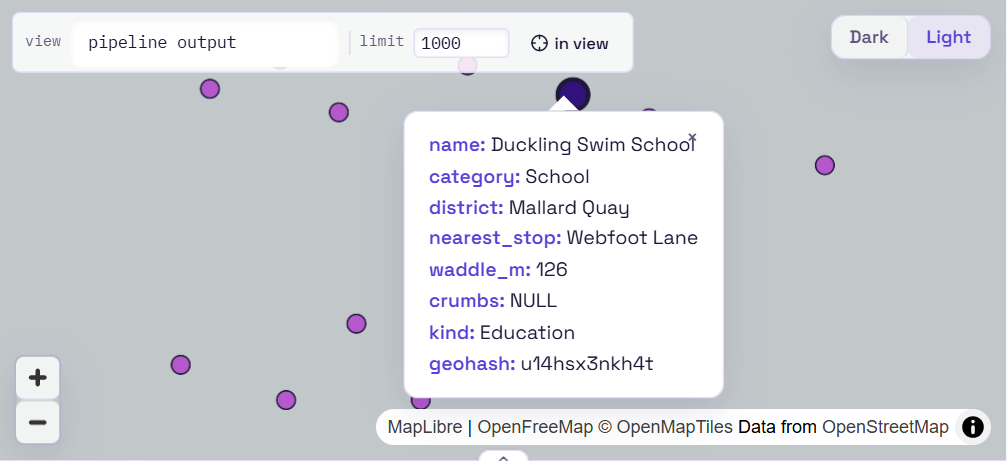
Map toolbar
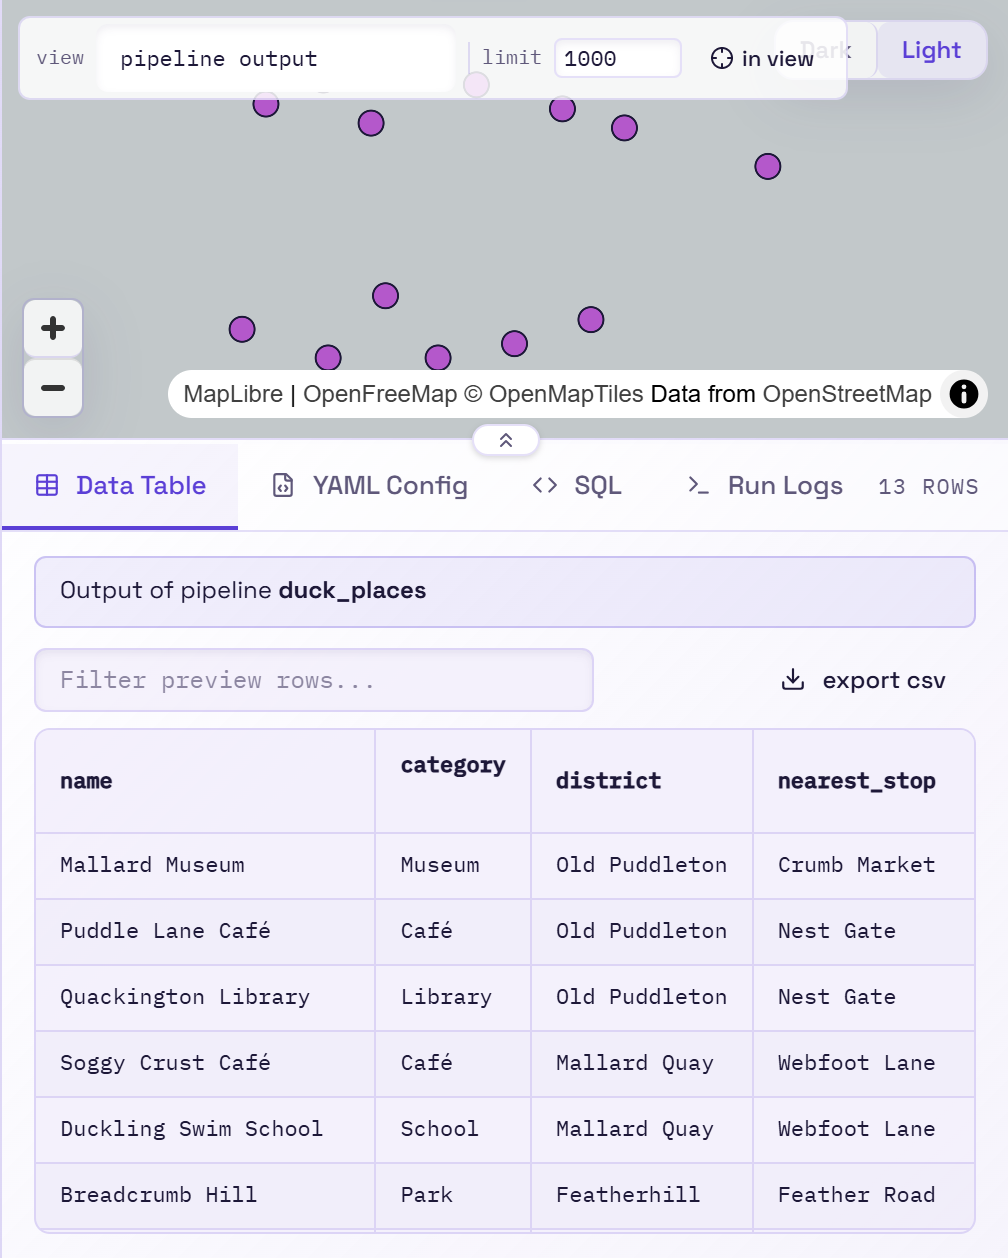
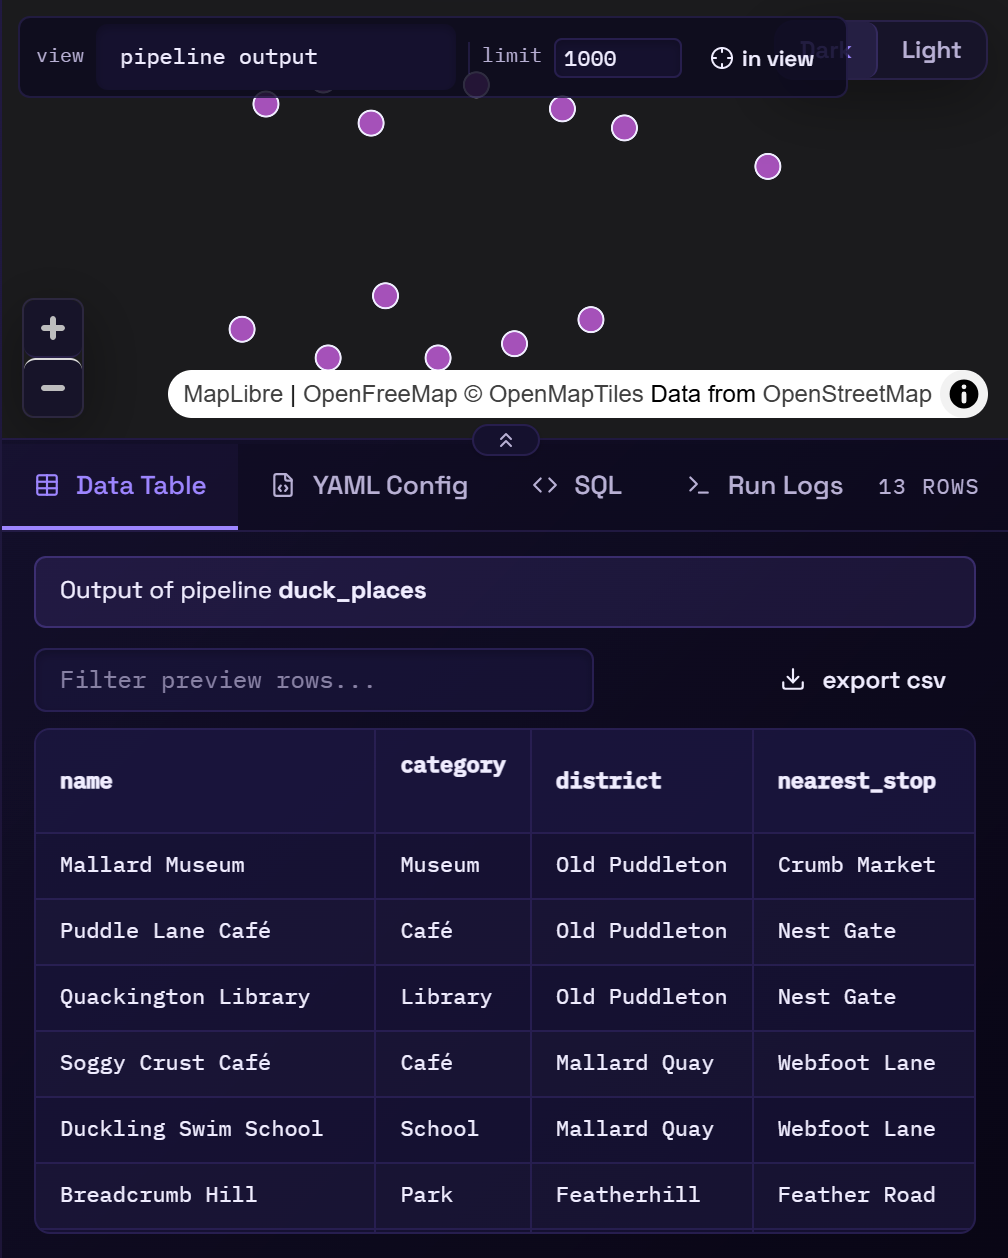
- view: pipeline output, or any single source.
- limit: how many features to fetch (default 1,000, no upper bound). Above 20,000 the editor warns that the map and table may get slow or unresponsive. The table shows limit reached when there may be more.
- in view: preview only features inside the current map extent, rather than the first N. While it's on, panning or zooming re-runs the preview. Use it to inspect one area of a big dataset.
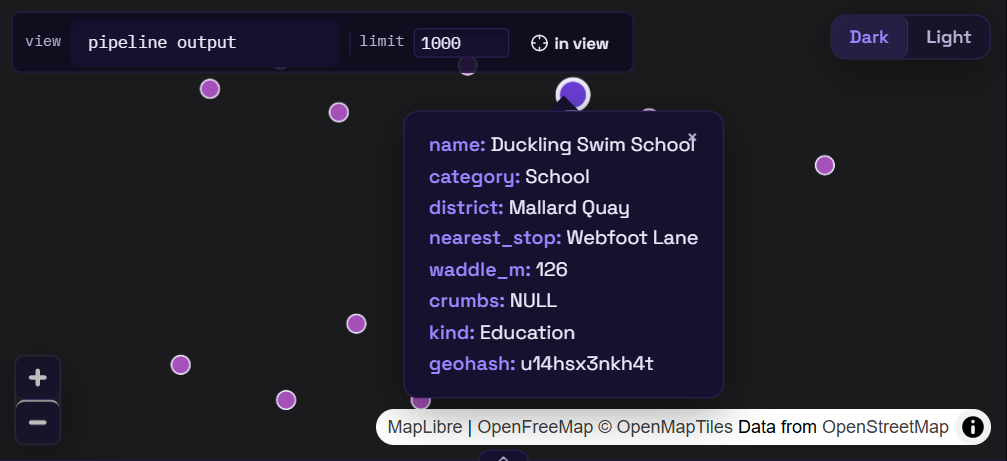
- Light / Dark: switch the basemap. It follows the editor's theme by default; this overrides it until the next theme toggle.
Hover a feature to highlight it. Click it to select it: it's drawn on top in indigo, its attributes open in a popup, and its row is highlighted in the Data Table. When features overlap where you click, the popup says so (1 of 3 here) and its arrows step through them. Click empty map, or close the popup, to clear the selection. The selection stays through a refresh as long as the selected row comes back unchanged.
Data Table
The table shows the same rows as the map (geometry hidden). Click a column header to sort, and type in the filter box to search all columns. export csv downloads what's shown.
Click a row to select its feature on the map, which pans there if it's out of view. Click it again to clear the selection. Hovering a row highlights its feature, and Enter selects the focused row.
Problems
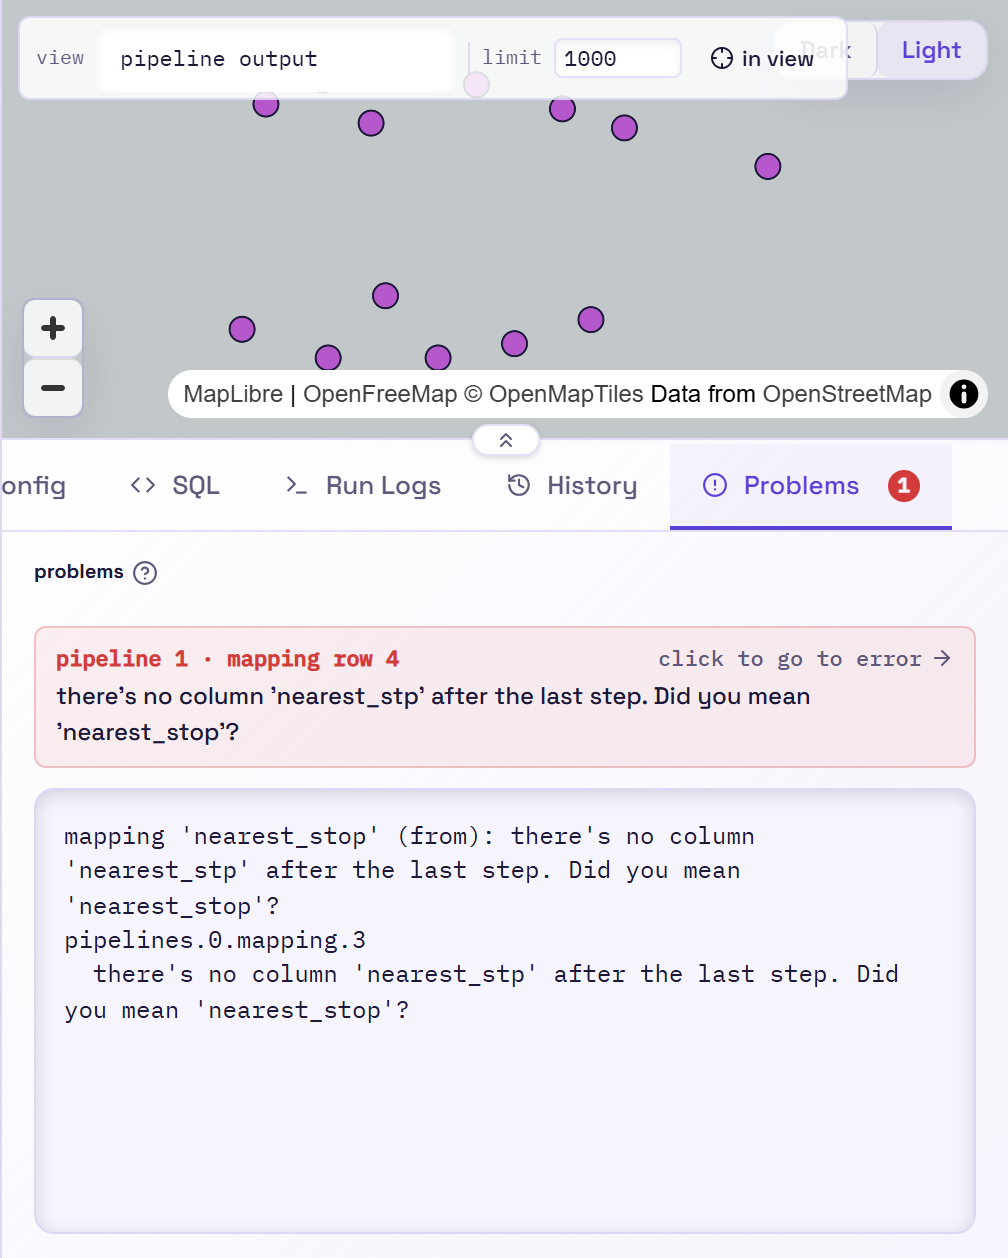
When the config is invalid, the Problems tab opens and its badge shows the number of
errors. Each problem says where it is (step 3 · source, mapping row 2) and what's wrong.
Click it to go to the error: the editor opens the section, expands the card, scrolls to it and
flashes it. The card or mapping row stays outlined in red until the problem is fixed. Hover a
problem to see its config path (pipelines.0.steps.2.source).
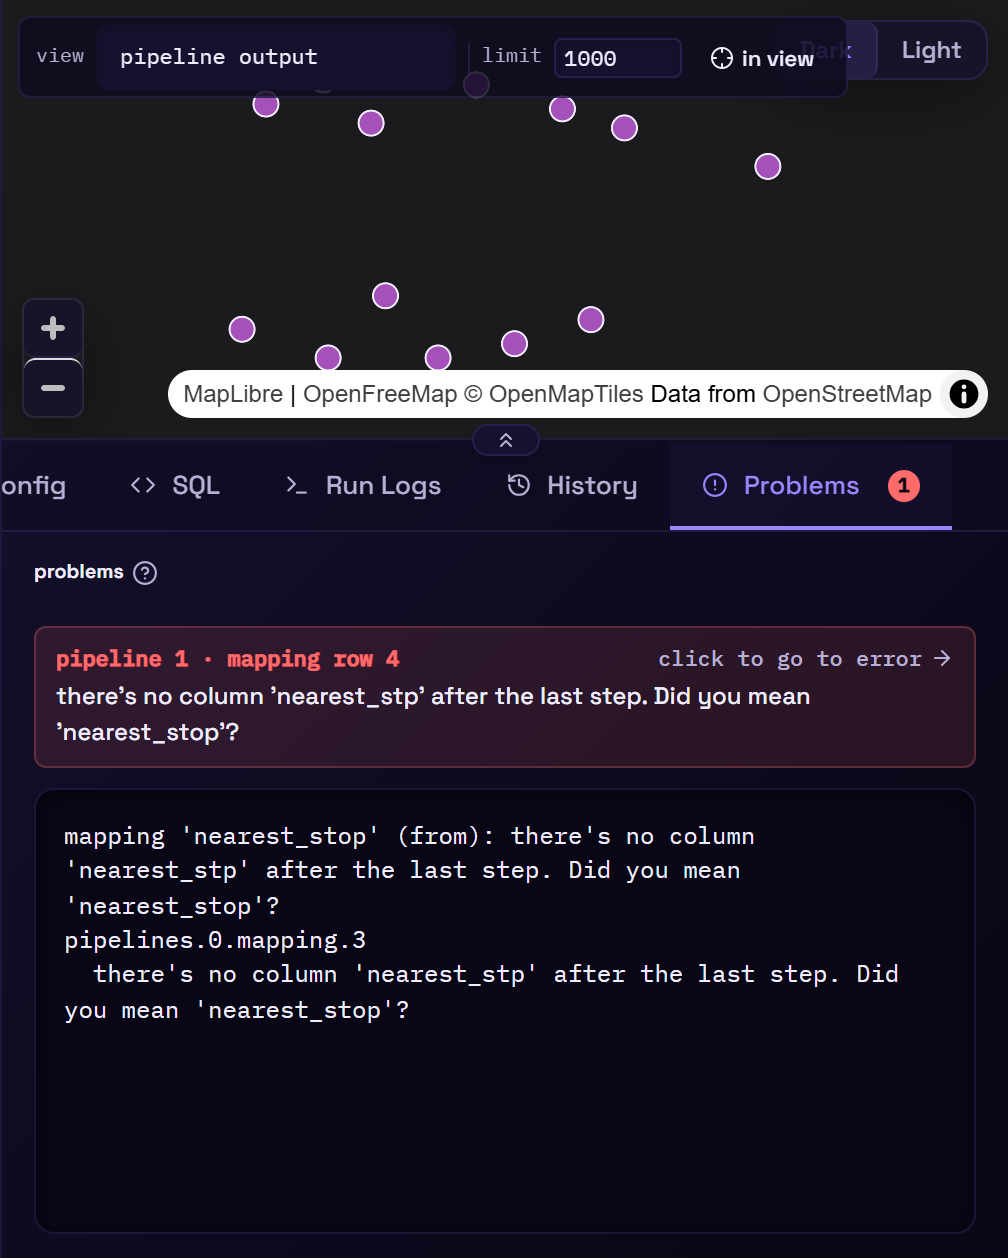
Mapping errors from the preview link to their mapping row the same way, and say what's wrong in words: a column that isn't there names the step that dropped it (step 8 (combine_lines) drops 'width'), or the closest column name there is (Did you mean 'nearest_stop'?).
The tab opens by itself only when a problem first appears while you're on Data Table, and once the preview works again it switches back there. If you move to another tab in between, or open Problems yourself, the editor leaves the tabs alone.
Errors come from the same validation as duck-soup check, so a config that's valid in the
editor is valid on the command line.
Saving
save (Ctrl+S) writes pipelines/<save as>.yaml in the
project folder. The
editor asks before overwriting a different config that already has that name.
The file is plain YAML: commit it, diff it, run it with duck-soup run, or load it back
later from the load dropdown.
Running
run (Ctrl+Enter) runs every pipeline in the config and writes the output. While it runs, the button shows elapsed seconds and cancel appears next to it. Previews, row counts and source inspection keep working during a run. When it finishes, the Run Logs tab shows:
- each source being read and each step being built, with timings,
- the rows written to each layer, rejects layers included,
→ wrote output/xyz.gpkg [12.3s]on success,- the error and the last lines of the traceback on failure. If DuckDB itself crashed, the error says so; see Crashes.
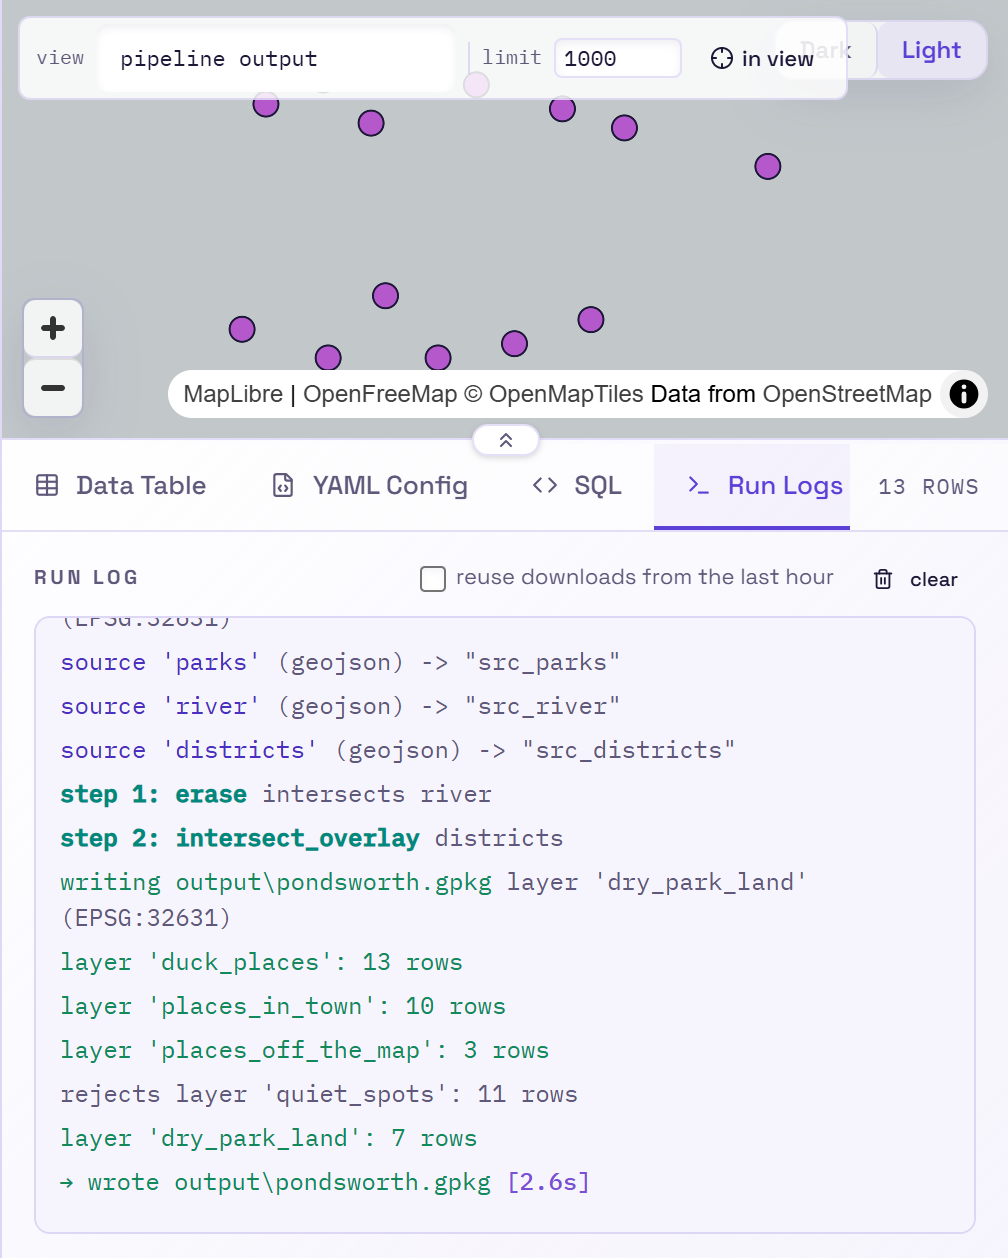
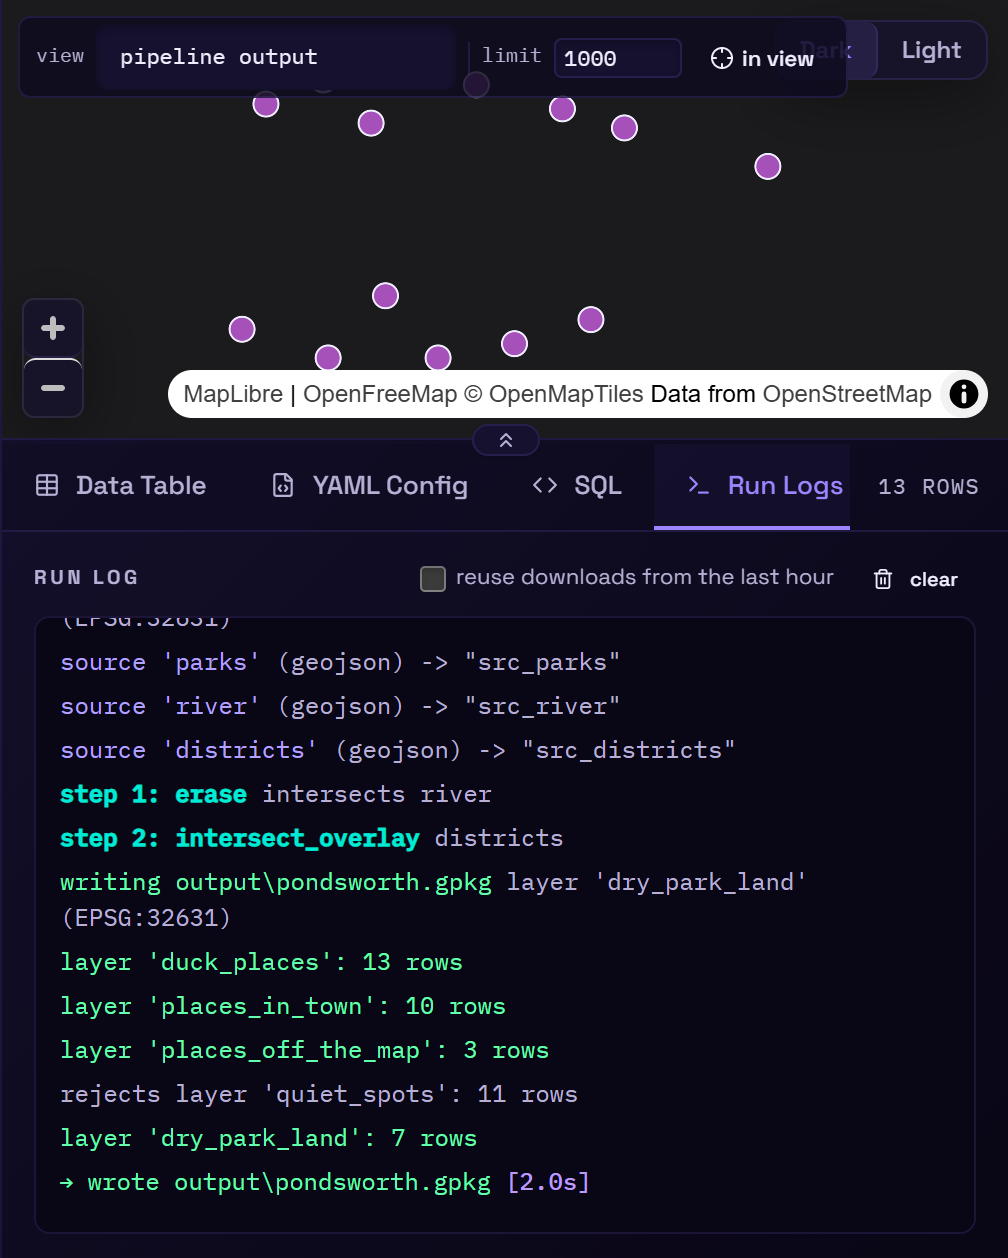
New runs are appended under a divider so you can compare them. clear empties the log.
A run downloads its remote files again. Tick reuse downloads from the last hour, in the Run Logs header, to have it read a file downloaded less than an hour ago (for the previews, or by the last run) as it is; the log then says Using the download of … from 12 min ago. The setting is remembered in this browser.
cancel stops the run at once. Layers already written stay in the output, and the one being written when you cancelled may be incomplete, so run again before using the file. A run cancelled while it's still downloading its sources hasn't written anything; the downloads finish in the background and are reused by the next preview or run.
The log arrives at the end
A run is a single request: the log fills in when it completes, not line by line. For long jobs, consider the command line or an exported script.
Run history
The History tab lists the config's past runs, newest first: when each ran, whether it
was started from the editor or from duck-soup run (cli), how many layers and rows it
wrote, and how long it took. A failed run shows its error. Click a run to see the rows per
layer, the output path, a fingerprint of the config version that ran, and its log.
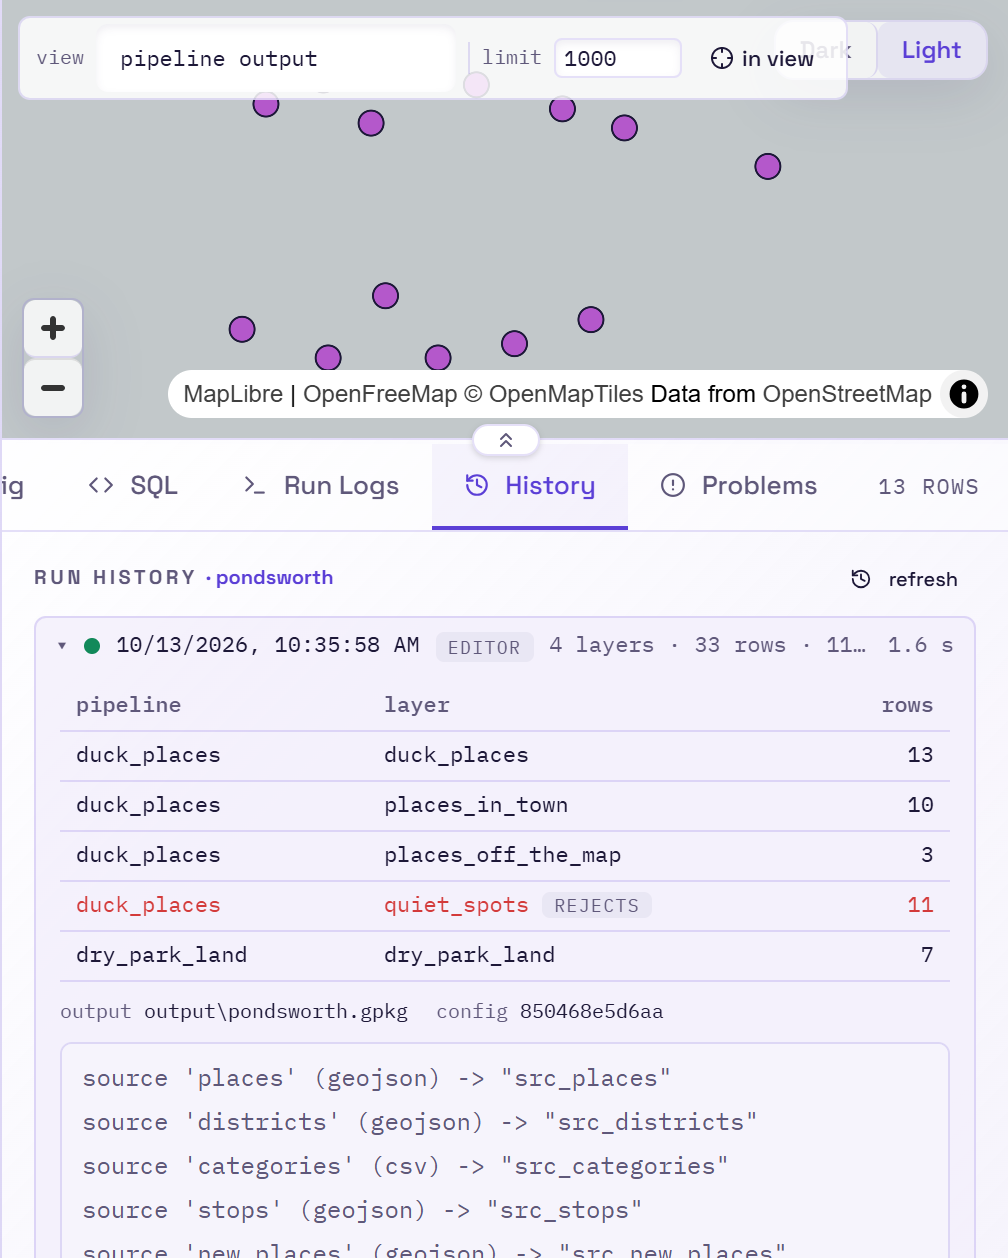
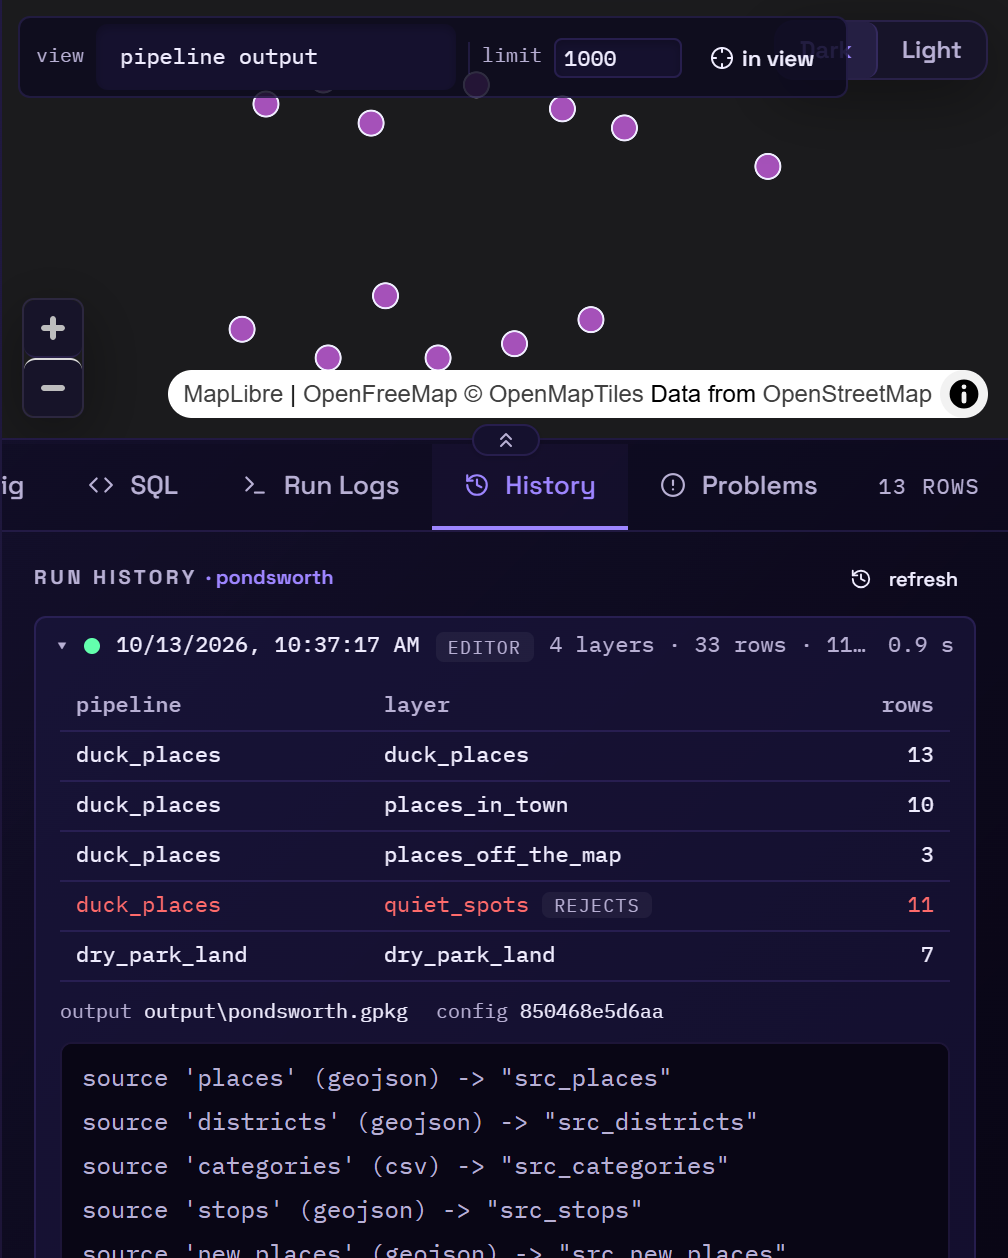
Each run is recorded as a JSON file in runs/<config name>/ in the
project folder, and the
newest 200 runs per config are kept. Runs from the command line are recorded there too, so a
scheduled run shows up in the editor; see Scheduling. A config
needs a name, so save it before its first run to keep its history.
SQL tab
The SQL tab shows what the engine does with the current pipeline: the view it creates for each source (reprojected to the working CRS), each derived source, the base and each step, and the SELECT written for each output layer. A step with a rejects layer has three views: all its rows, the rows that pass, and the rejects. Nothing is read to show it, so it updates with every change. Services (WFS, OGC API, ArcGIS REST) show a placeholder for the file they're downloaded to, and a postgres source shows the table but not its connection string.
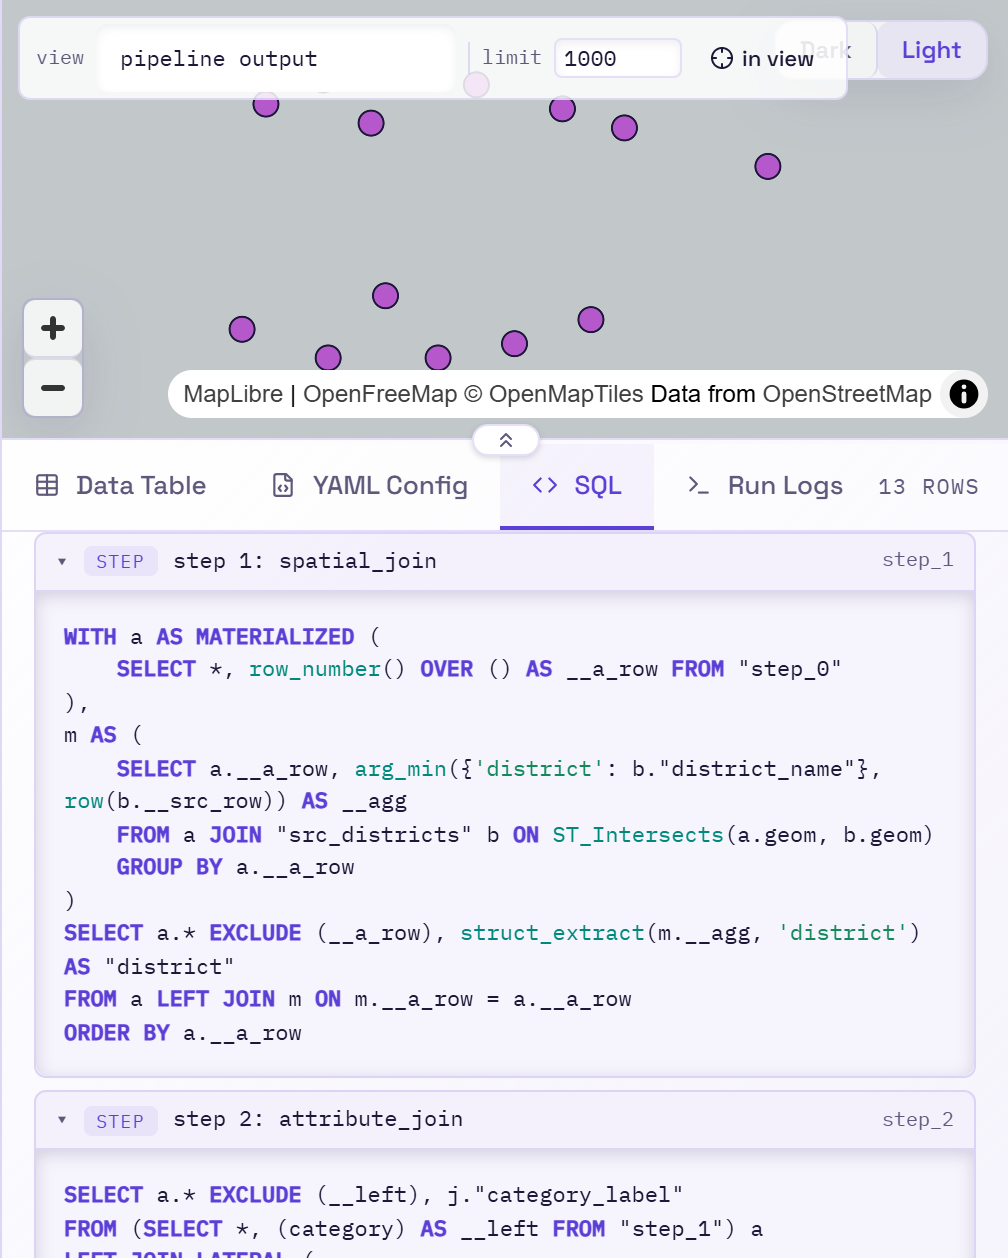
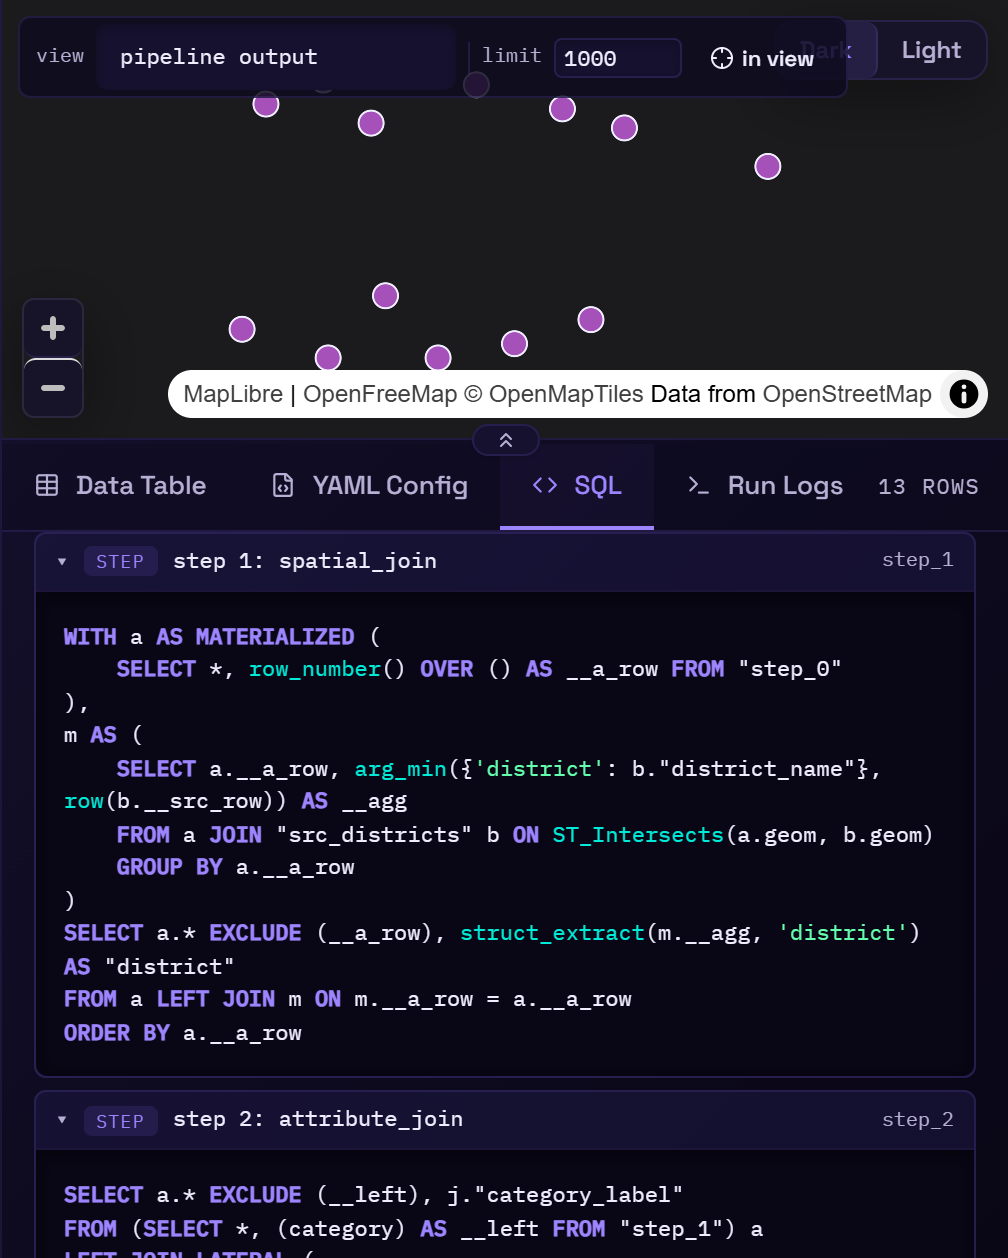
The <> button on a step card opens this tab at that step. copy all copies the whole plan as one SQL script, which you can run in a DuckDB shell (with the spatial extension loaded) to dig into a step.
YAML Config tab
This tab shows the YAML the editor would save, with line numbers. Use it to learn the format, or to copy the config somewhere else.
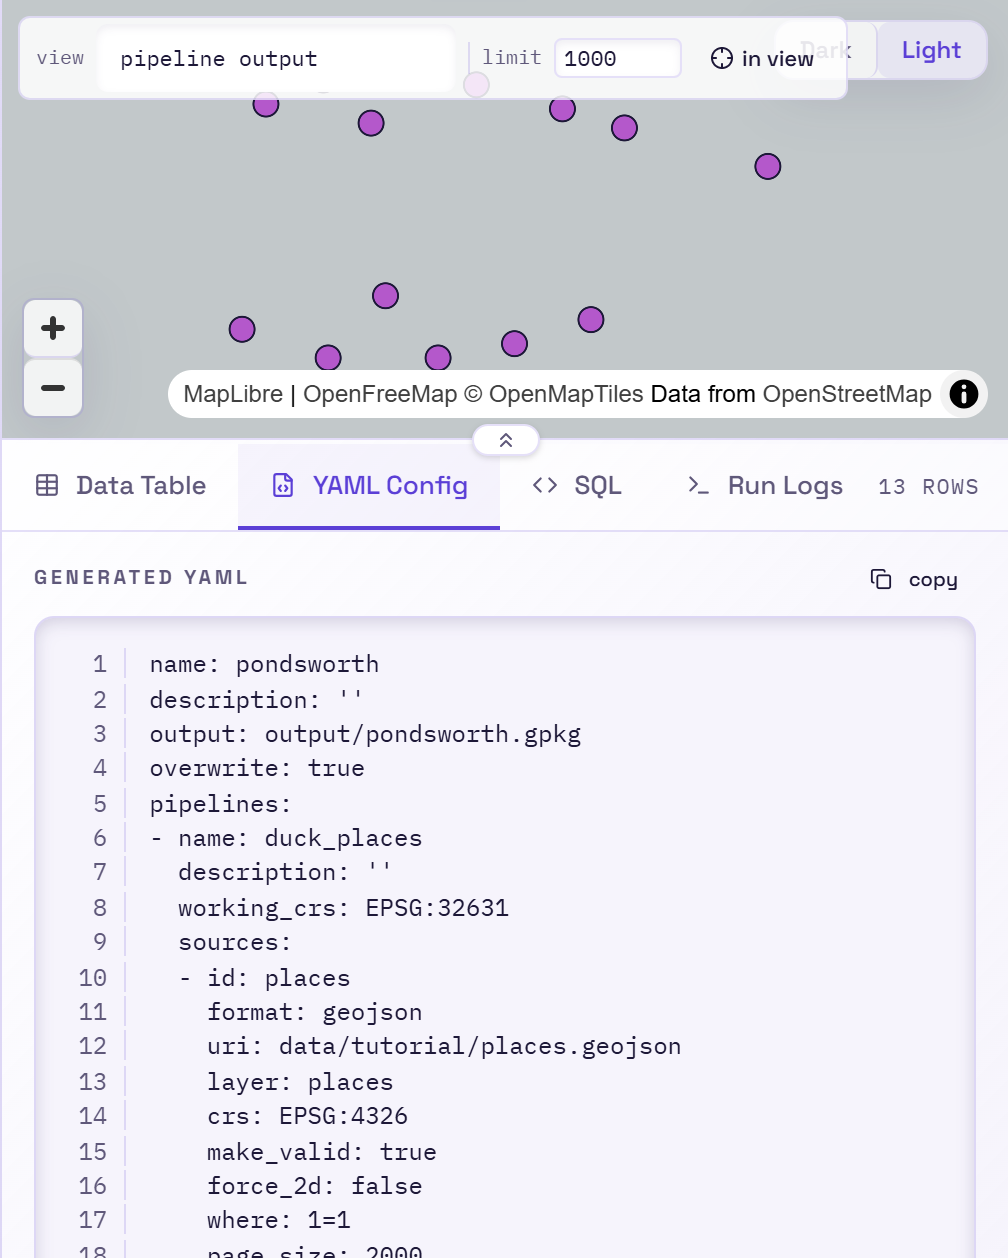
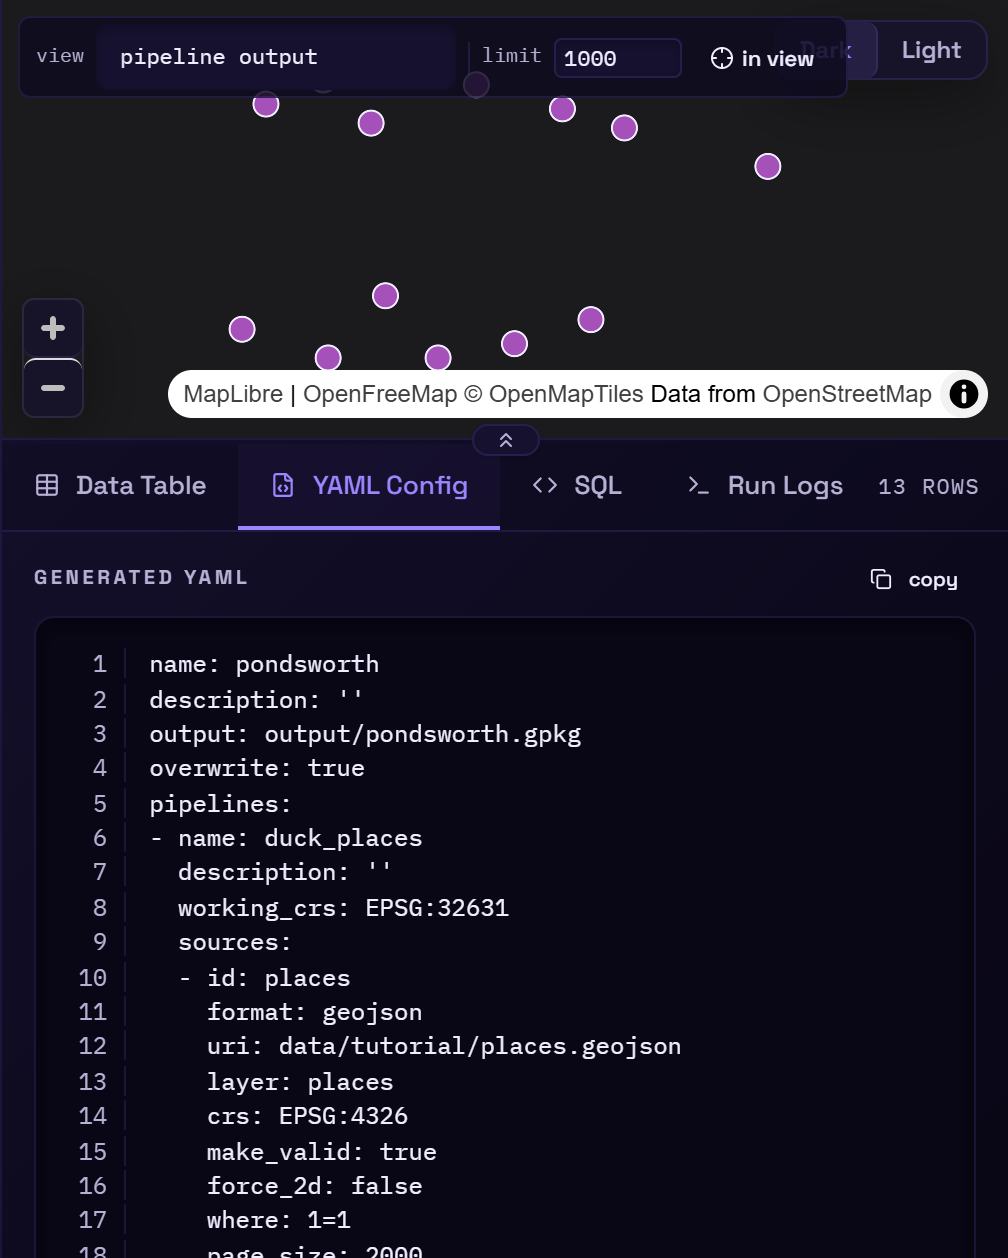
copy puts the YAML on the clipboard.
Import
import in the top bar opens a box to paste a full pipeline YAML. It's parsed and validated on the server, then replaces what's open in the editor (you're asked first if you have unsaved changes). Save it to keep it.
Export as a Python script
export .py in the top bar downloads the config as a standalone Python script, with the
pipeline YAML embedded. Run it with python my_pipeline.py on any machine with
duck-soup-etl installed: no server or editor needed. Relative paths resolve against the
folder you run it from. See Scheduling for using it
from an orchestrator.