Tour of the editor
The editor is a visual front end for the pipeline YAML. Everything you build in it becomes a YAML file you can save, commit and run from the command line. Everything you can write in YAML can also be loaded into the editor.
Start it with duck-soup serve (or the Docker image) and open http://localhost:8000.
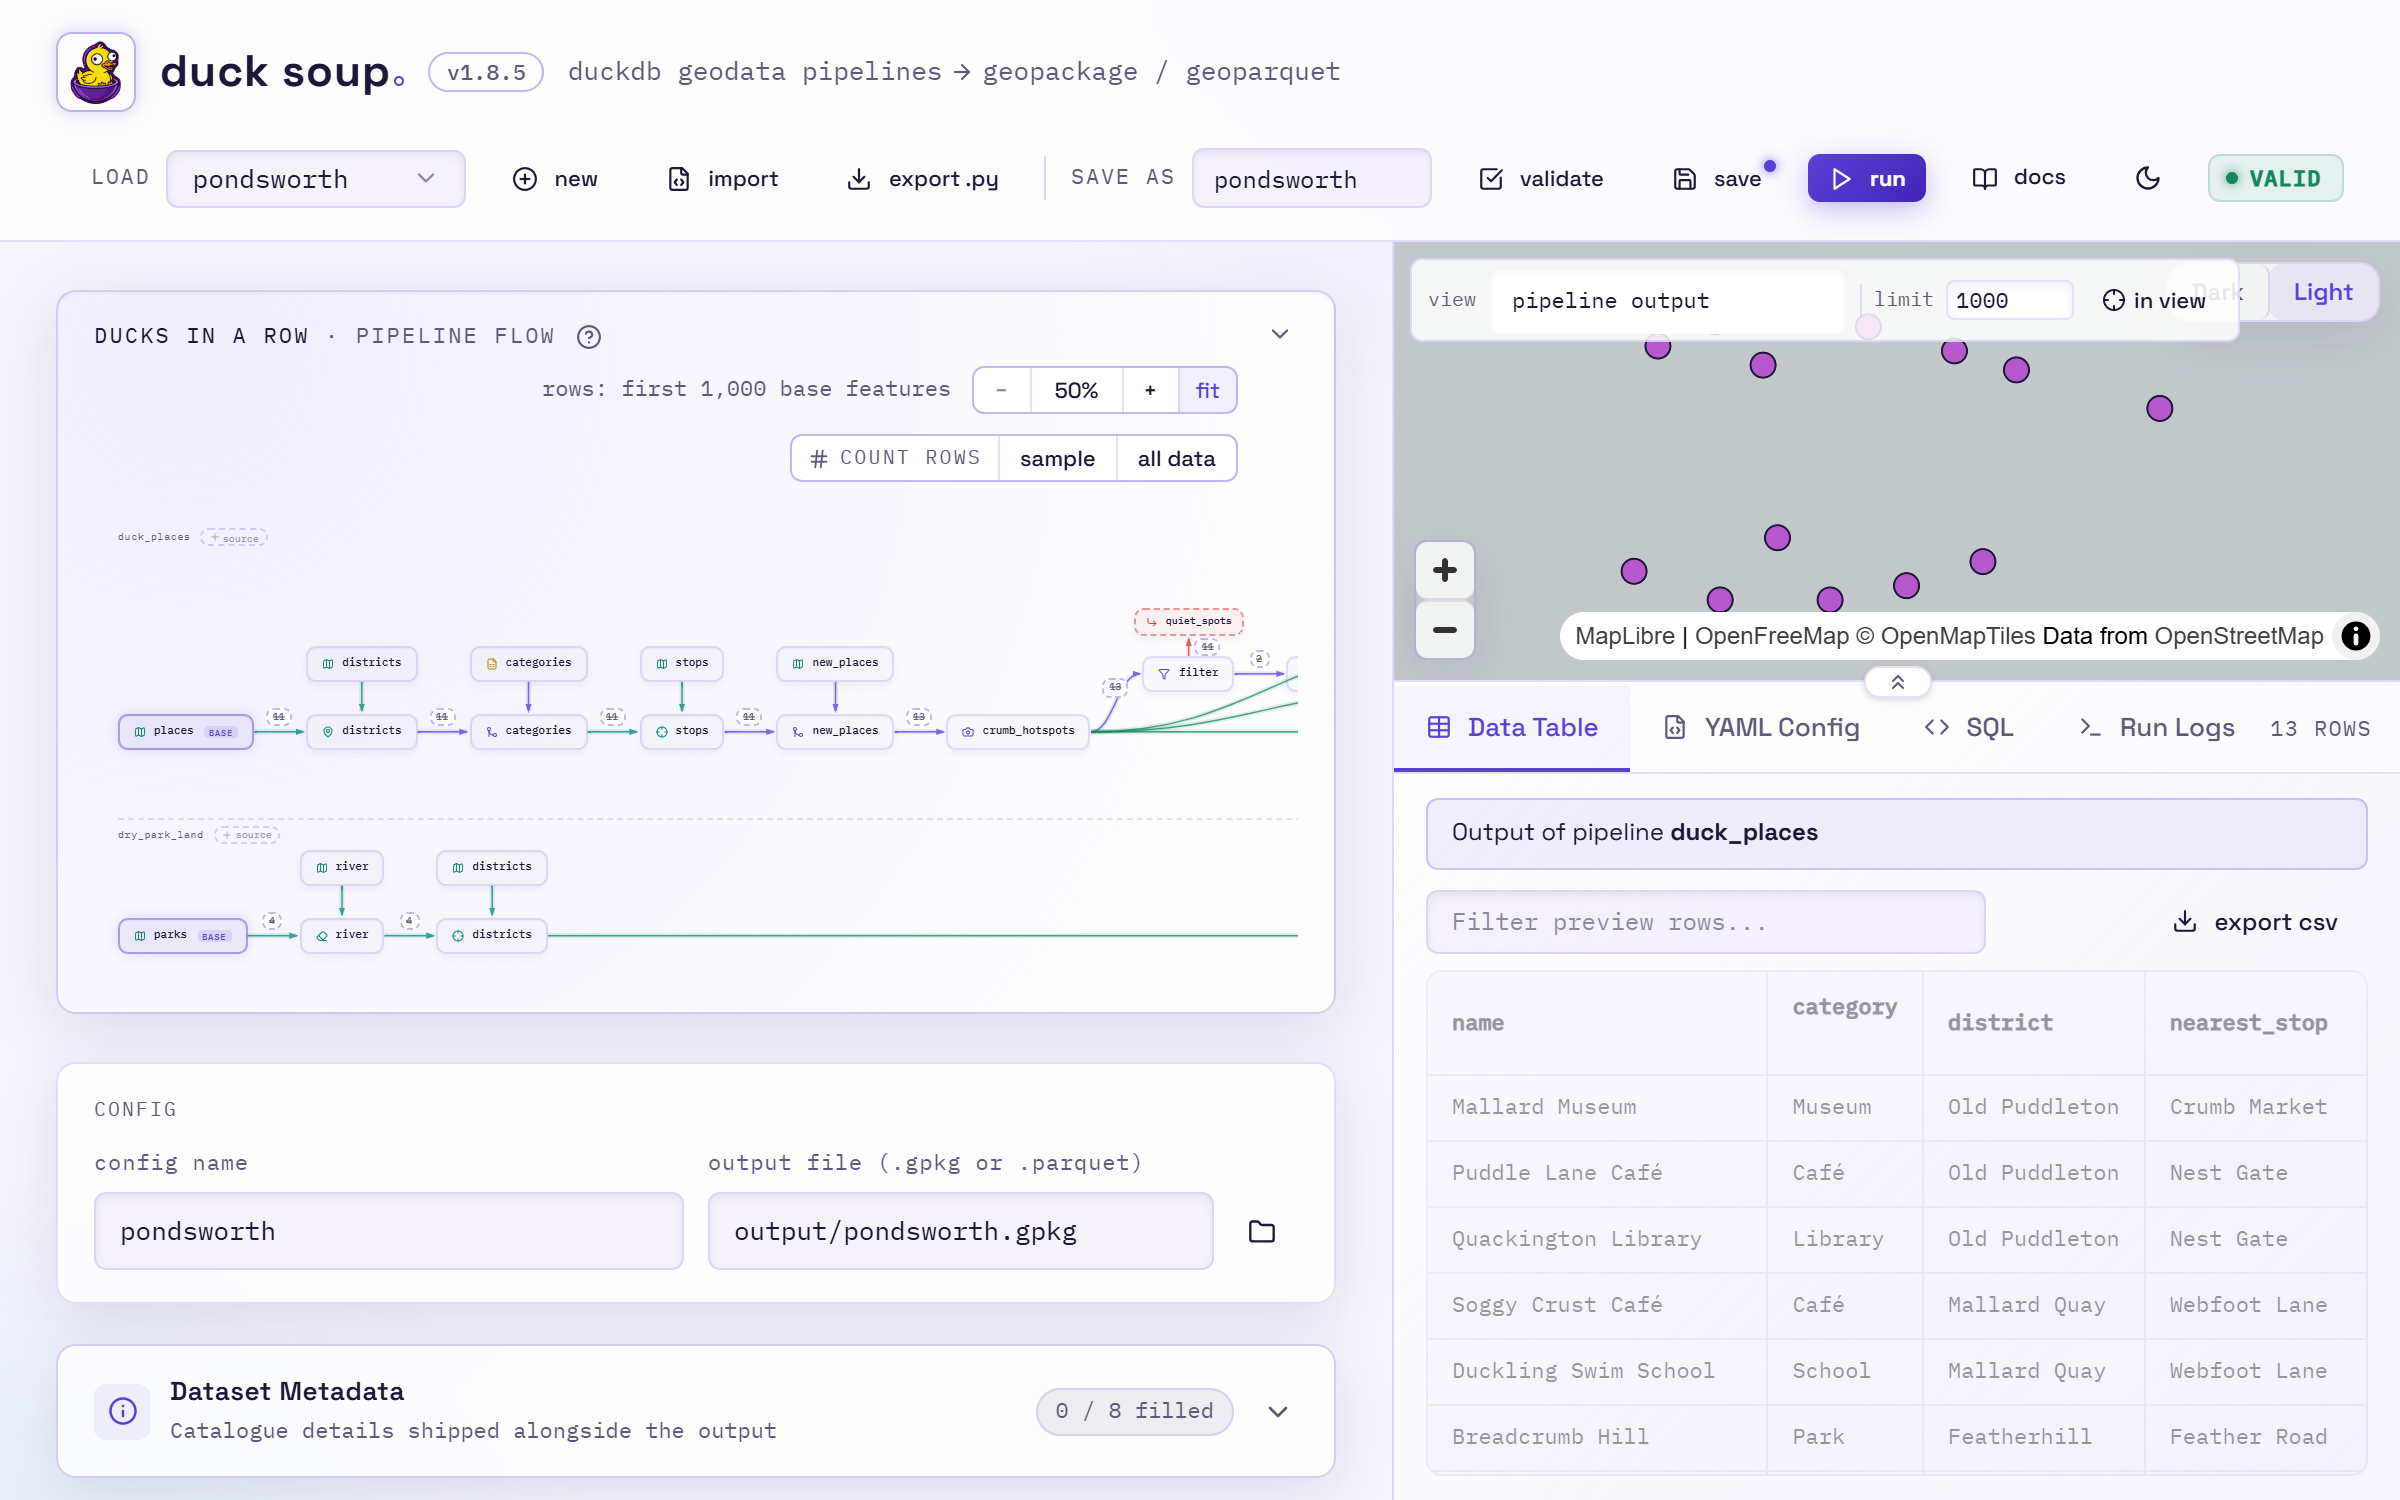
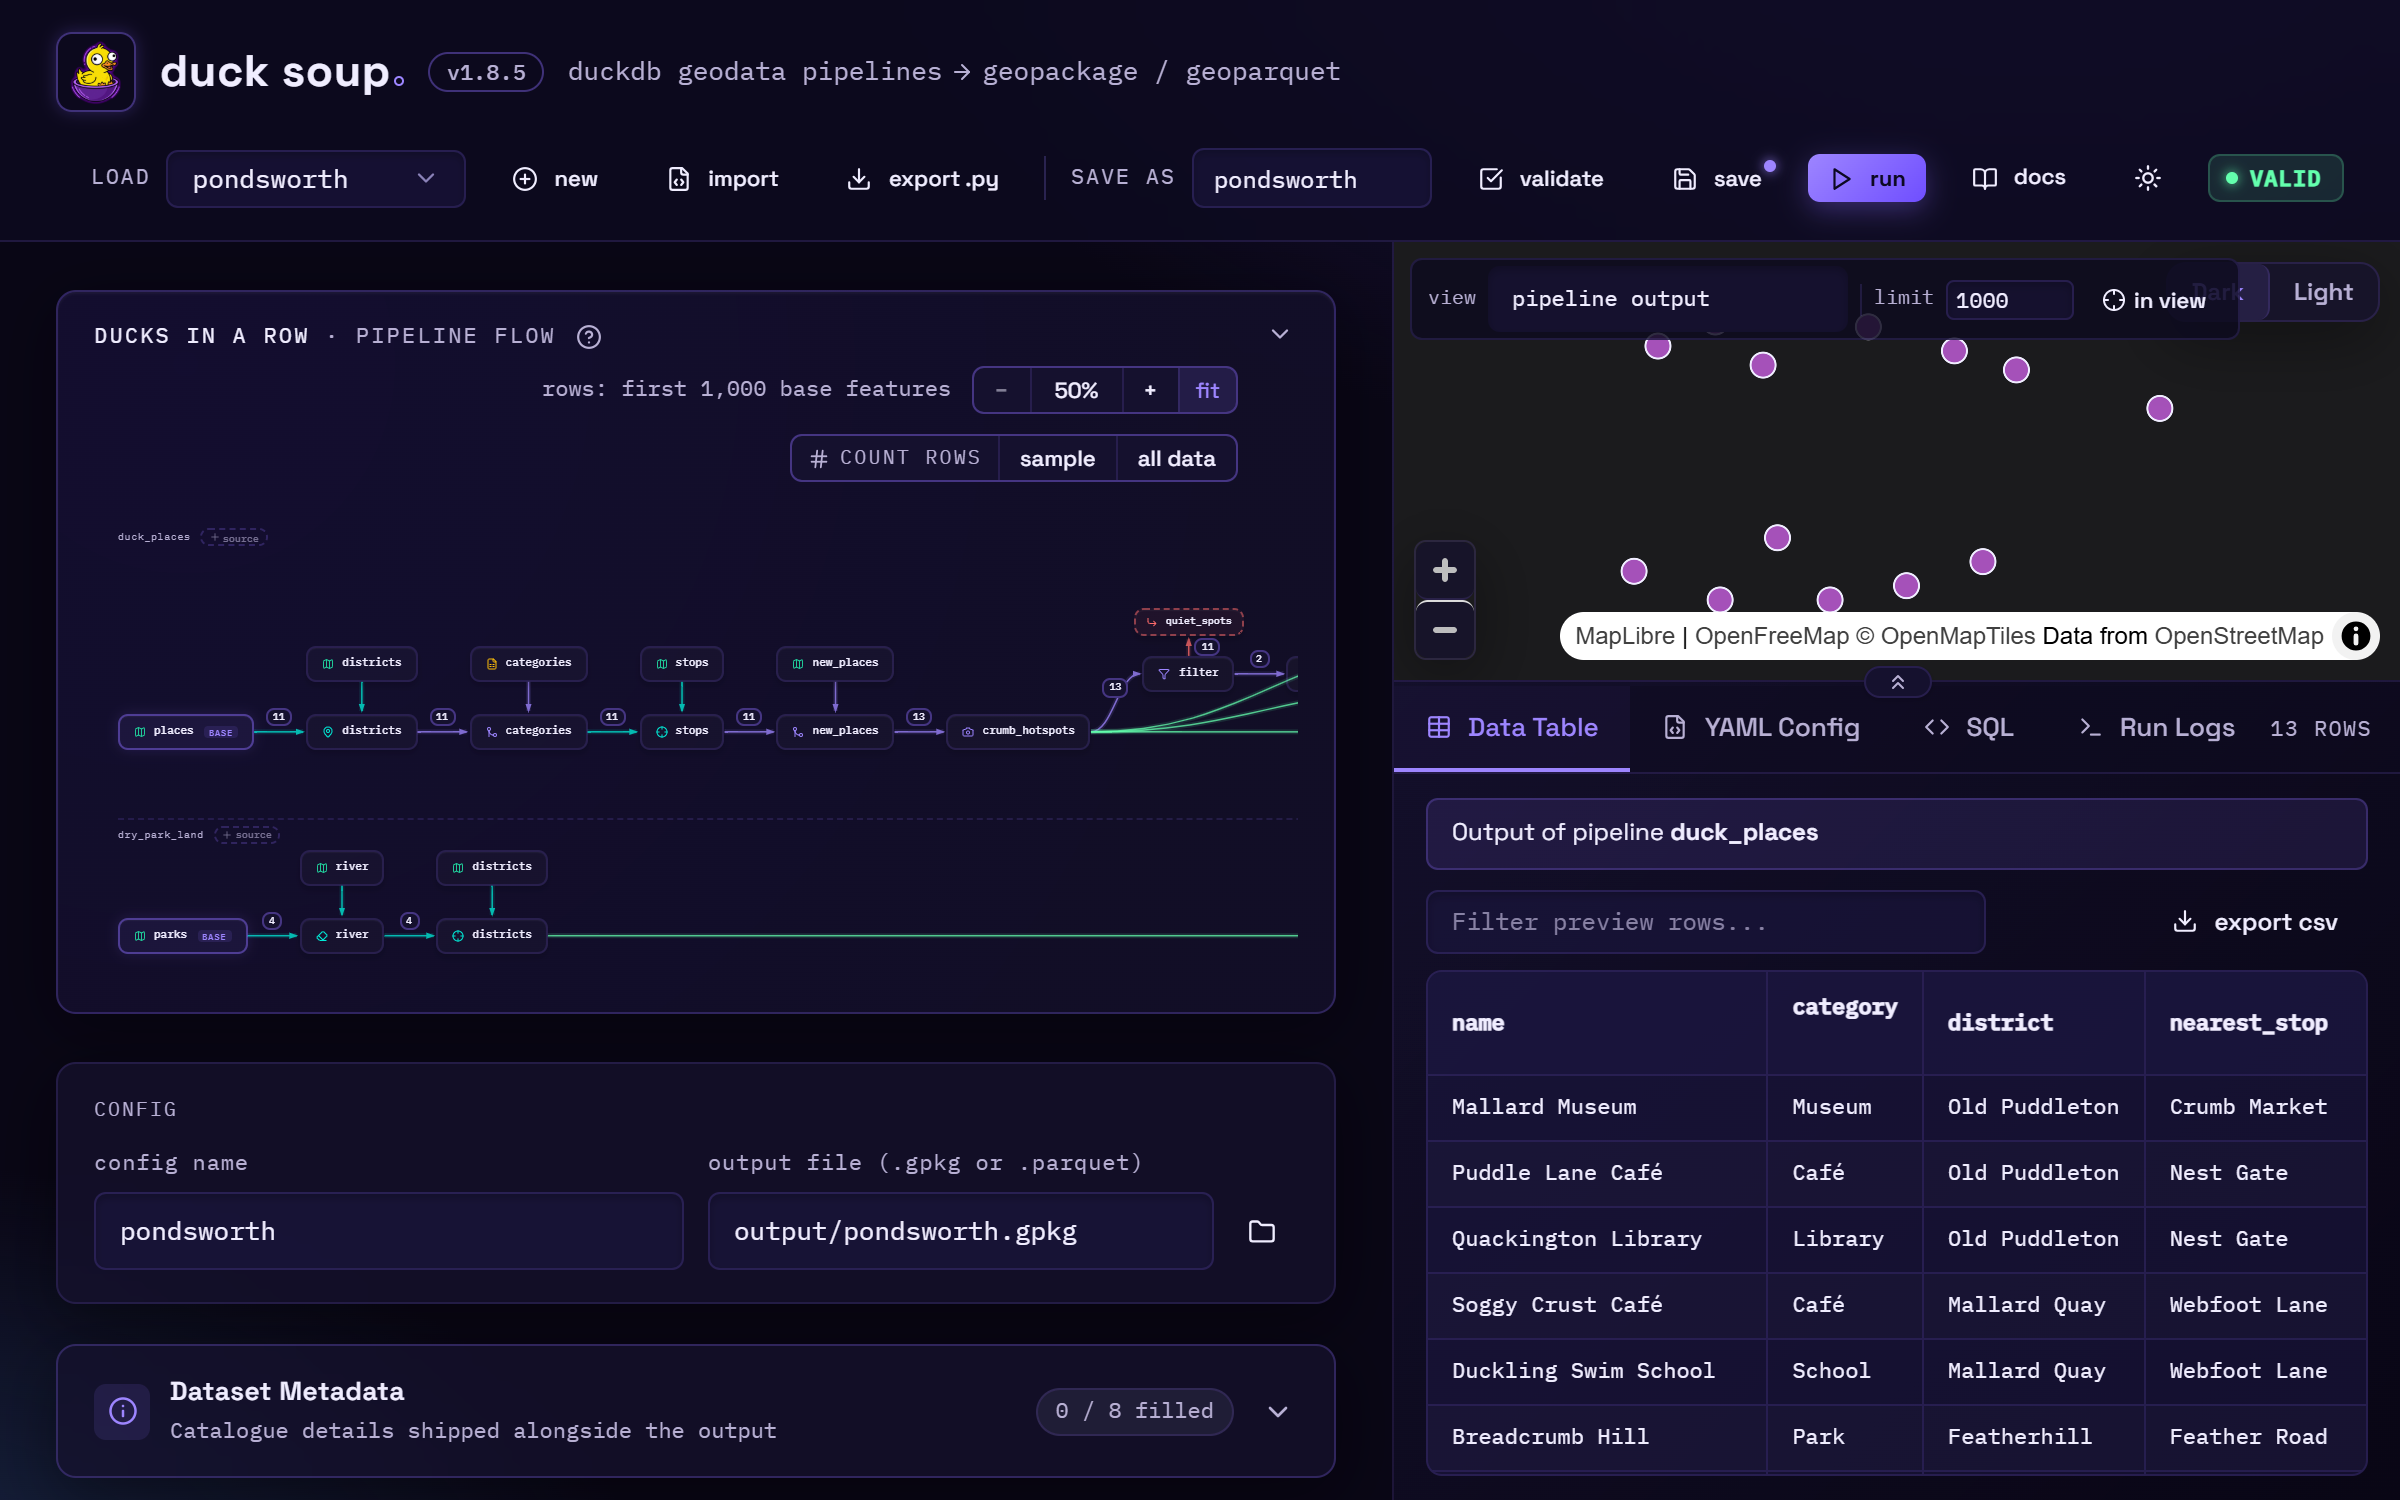
The left side is where you build. The right side is where you see the result.
Top bar
| Control | What it does |
|---|---|
| version | The badge next to the name (e.g. v1.3.3). Click it for the release notes. When PyPI has a newer release it reads update to …, and a click copies the upgrade command (see Install); run it, then restart duck soup. |
| load | Opens a config saved in the project folder's pipelines/ directory. On startup, the editor reopens the last config you used. |
| new | Starts a blank config with one empty pipeline. |
| import | Opens a dialog where you paste a pipeline YAML from anywhere (git, email, a colleague). It replaces what's open. |
| export .py | Downloads the config as a standalone Python script that runs without the editor. See Export as a Python script. |
| save as | The file name used by save (pipelines/<name>.yaml). It defaults to the config name. |
| validate | Re-checks the config now. The editor already validates automatically shortly after every change. |
| save | Writes the YAML. The button is highlighted when you have unsaved changes, and the editor warns before you navigate away and lose them. |
| run | Runs every pipeline and writes the output file. The log appears in Run Logs. |
| cancel | Shown while a run is going. Stops it at once; see Running. |
| docs | Opens these docs in a new browser tab. |
| ☀ / ☾ | Switches the editor between dark and light mode. It follows your OS setting until you click it, and then remembers your choice. The map's basemap switches with it. |
| status | Shows valid, validating…, previewing… 42% · 8s on a slow preview (in full at the top of the preview panel), running…, what a preview is waiting on (e.g. roads: downloading… 23.4 MB), or the first line of an error. Click it to open the Problems tab. |
Ducks in a row: the pipeline flow
The ducks in a row panel at the top draws the config as a flow chart, one row per
pipeline. The name comes from the idiom. Getting your ducks in a row means putting things in
order, and that's what a pipeline is: an ordered chain your features waddle through, one step
after another, before they file into the output. Each row starts with its base source (marked
base). The steps run left to right,
each with the source it joins against above it, and the pipeline's output layers converge on
the shared output file: with several layers, their lines join one trunk with a single arrow into
the file. A step with a rejects layer has a
red side branch for it: below the step, or above it for a step on a snapshot branch. The
diagram redraws as you edit. Click the header to collapse it.
To see more or less of it:
- fit (the default) scales the whole flow to fit the panel, down to 50%. A flow too big even at 50% scrolls, and fit keeps fitting as you edit or resize the panels.
- − / +, or Ctrl+wheel (a pinch on a trackpad), zoom between 50% and 150%, around the pointer. The percentage button resets to 100%. A plain wheel still scrolls the page.
- Drag an empty part of the diagram to pan, sideways or up and down. The diagram takes up at most 60% of the window's height, and scrolls beyond that.
The zoom you pick is remembered per config, in your browser.
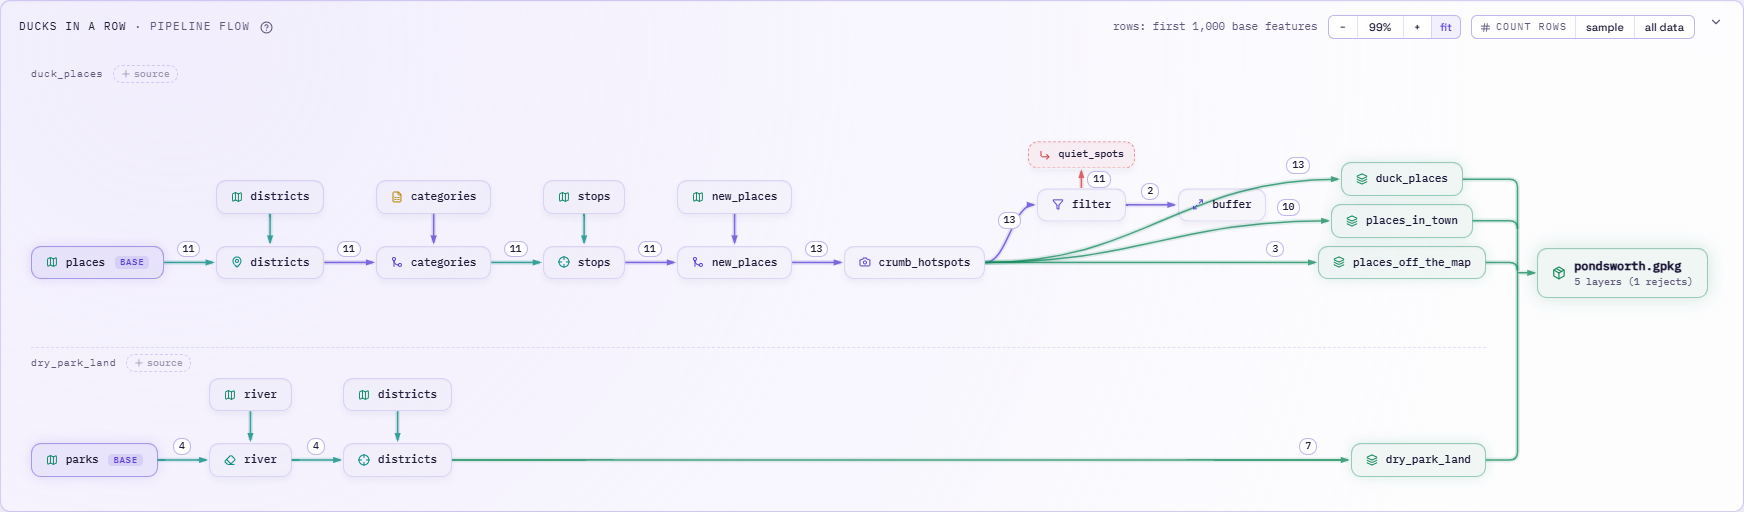
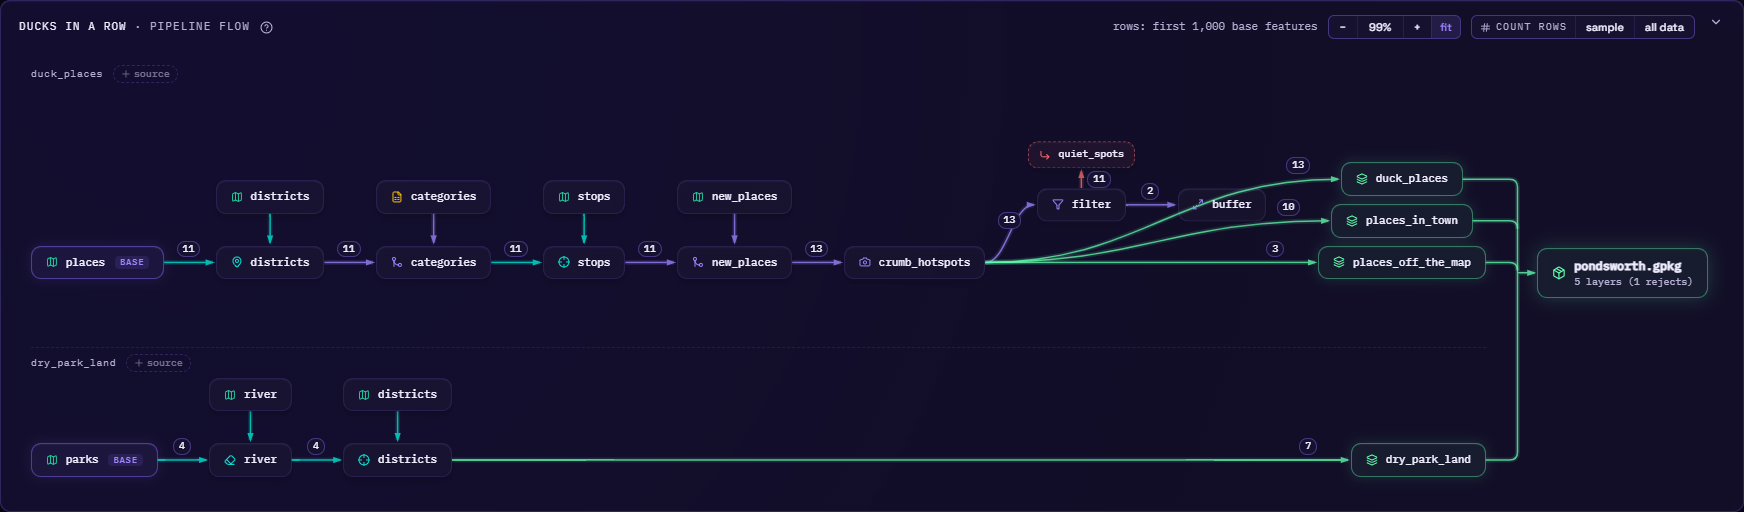
You can also build and edit the pipeline from the diagram:
| To… | Do this |
|---|---|
| edit a source, step or output layer | Click its node. Its card opens in a panel beside the diagram, so the flow, the map and the table stay in view while you edit. show in list jumps to the card in its tab, and Esc closes the panel. |
| insert a step | Hover the diagram and click the + on a connection. The step gallery opens, and the new step is inserted at that point, on the same branch, and opened in the panel. The + on the connection into the first output layer appends a step at the end. |
| add a source | Click + source next to the pipeline's name. |
| reorder steps | Drag a step node left or right, or focus it and press Alt+←/→. |
| rename the output file | Click the output node, type the new path and press Enter (Esc cancels). |
| preview a step's rejects | Click its red rejects node. |
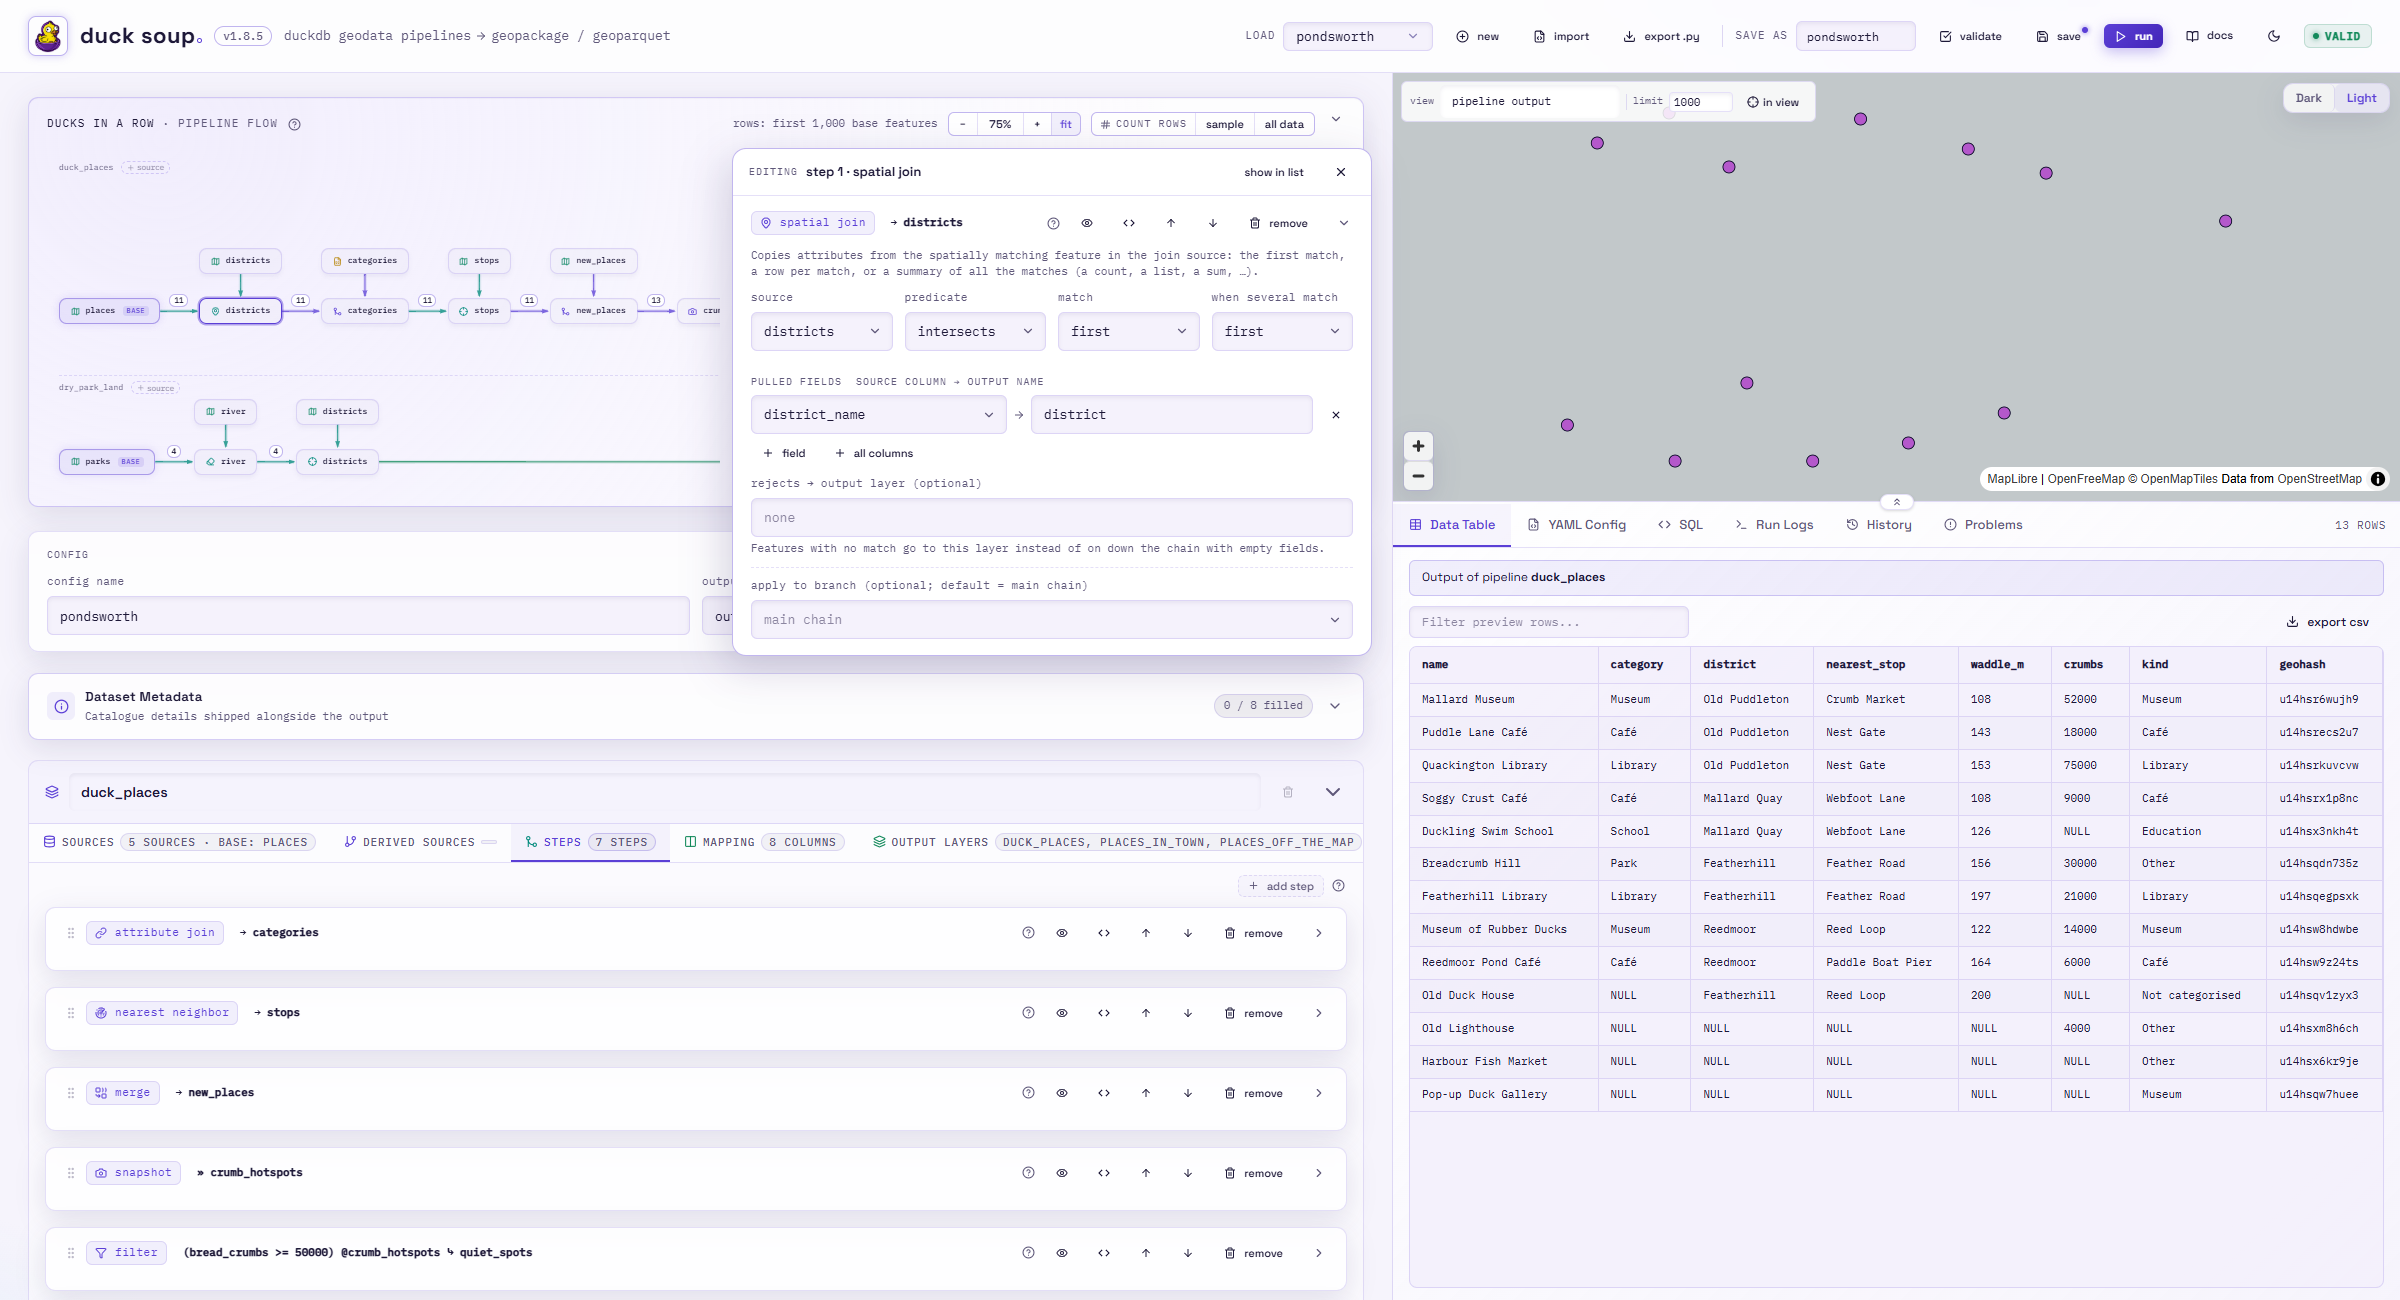
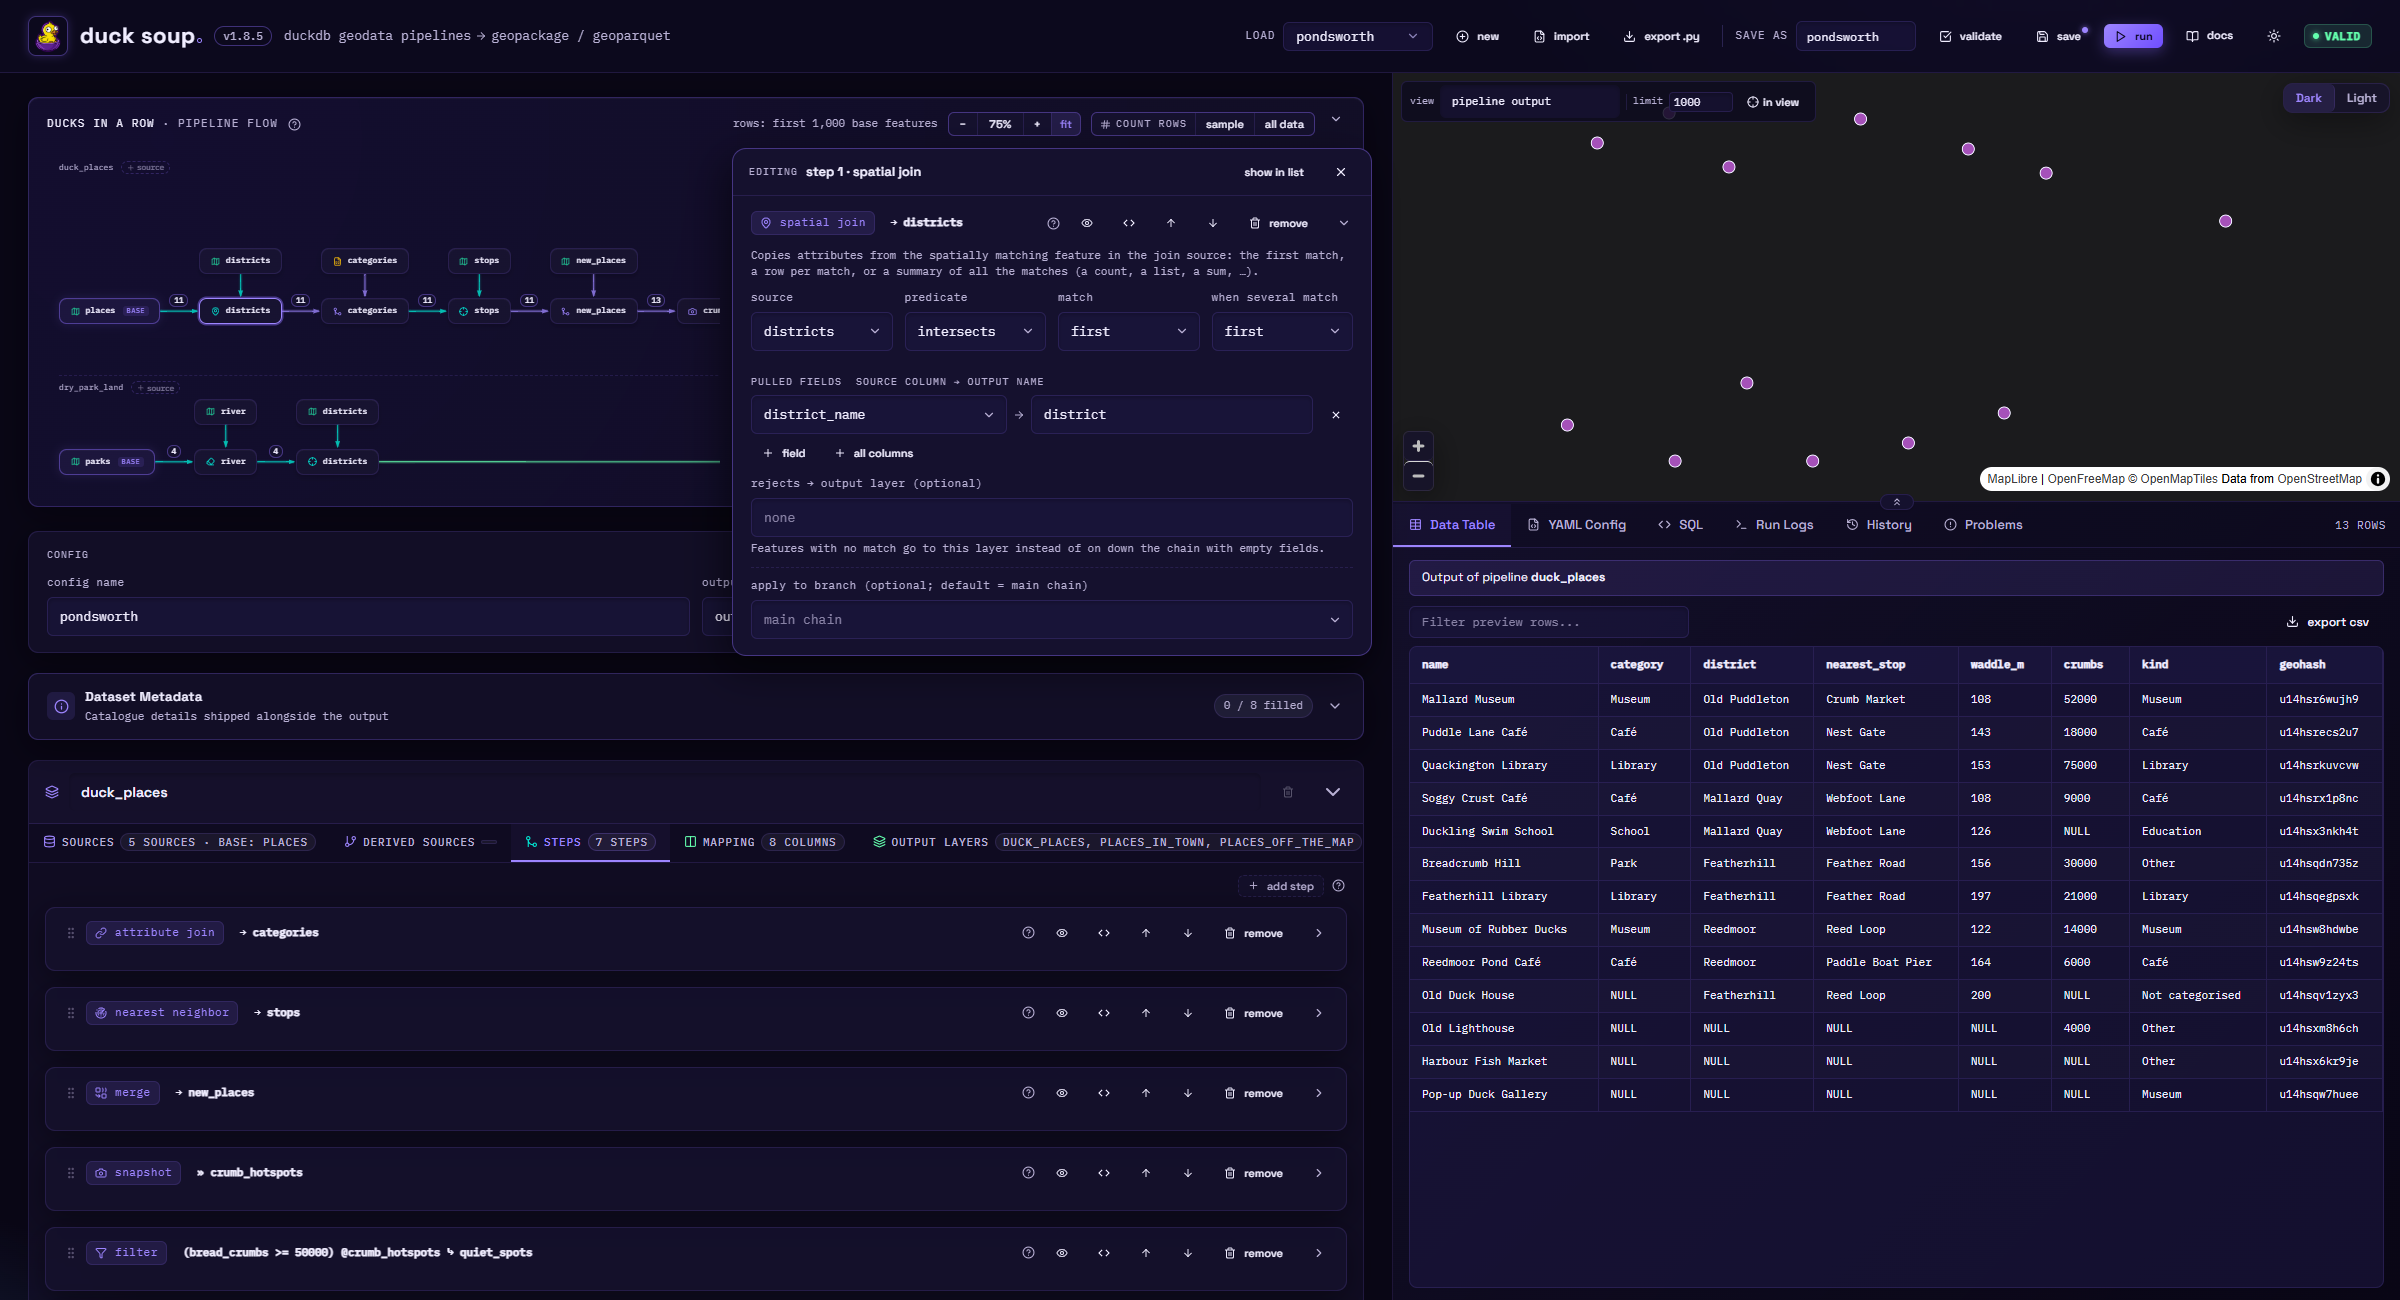
On a narrow screen, where the panel would cover most of the diagram, it opens below the diagram instead. Every change made from the diagram can be undone with Ctrl+Z, like one made in the cards.
Row counts
count rows in the diagram's header counts the rows on every connection:
- sample counts the first limit base features (the preview limit, by default 1,000), or only those in view while the map's in view is on. It's quick, and shows where rows get lost or multiplied.
- all data counts everything, including each source's rows. It takes about as long as a run.
Each number is the rows coming out of the node the connection starts at. On the connections into the output layers, it's the rows each layer gets after its own filter. Hover a number to see what was counted. After you change the pipeline, the numbers are crossed out until you count again. After a run, the connections into the layers and rejects layers show the rows the run wrote.
Config card and metadata
- config name: the config's
name. - output file: the
outputpath every pipeline writes into. A.gpkgpath writes a GeoPackage, a.parquetpath writes GeoParquet (one file per layer when there's more than one). The folder icon opens the file browser. - Dataset Metadata: optional catalogue fields (name, abstract, origin, update frequency,
geometric/attribute quality, access method, GDPR note). They're saved in the config's
metadata:block so they travel with the pipeline definition.
Pipeline cards
Each pipeline is a card with a name field, a remove button, and five section tabs. Each tab shows a short summary of what it contains:
| Tab | Covers | Guide |
|---|---|---|
| sources | the datasets, the base, the working CRS | Sources |
| derived sources | filtered/buffered views of sources | Sources |
| steps | joins and geoprocessing, in order | Steps |
| mapping | the output columns | Mapping |
| output layers | layer names, CRS, per-layer filters and mappings | Output layers |
+ add pipeline at the bottom adds another independent pipeline that writes into the same output.
Help links
Most panels have a small ? icon that opens the matching page of these docs in a new tab:
- each pipeline card's section tabs (sources, derived sources, steps, mapping, output layers),
- each step card, which links to its step type's reference,
- each source card, which links to the reference section for its current format,
- the step gallery, the expression builder and the codelist panel,
- the pipeline flow's title, and the Problems tab, which links to Troubleshooting.
Right-hand panel
- Map: a MapLibre map of the current preview, with a Light/Dark basemap switch. Hover a feature to highlight it, and click it to see its attributes.
- Data Table: the same preview rows as a sortable, filterable table.
- YAML Config: the generated YAML with line numbers, plus copy.
- SQL: the SQL behind each source, step and output layer of the current pipeline.
- Run Logs: output from every run, so you can compare runs.
- History: the config's past runs, from the editor and from
duck-soup run(scheduled runs too), with the rows each layer got. - Problems: validation and mapping errors. Click one to go to the card or mapping row causing it.
See Preview, validate & run for details.
Resizing the panels
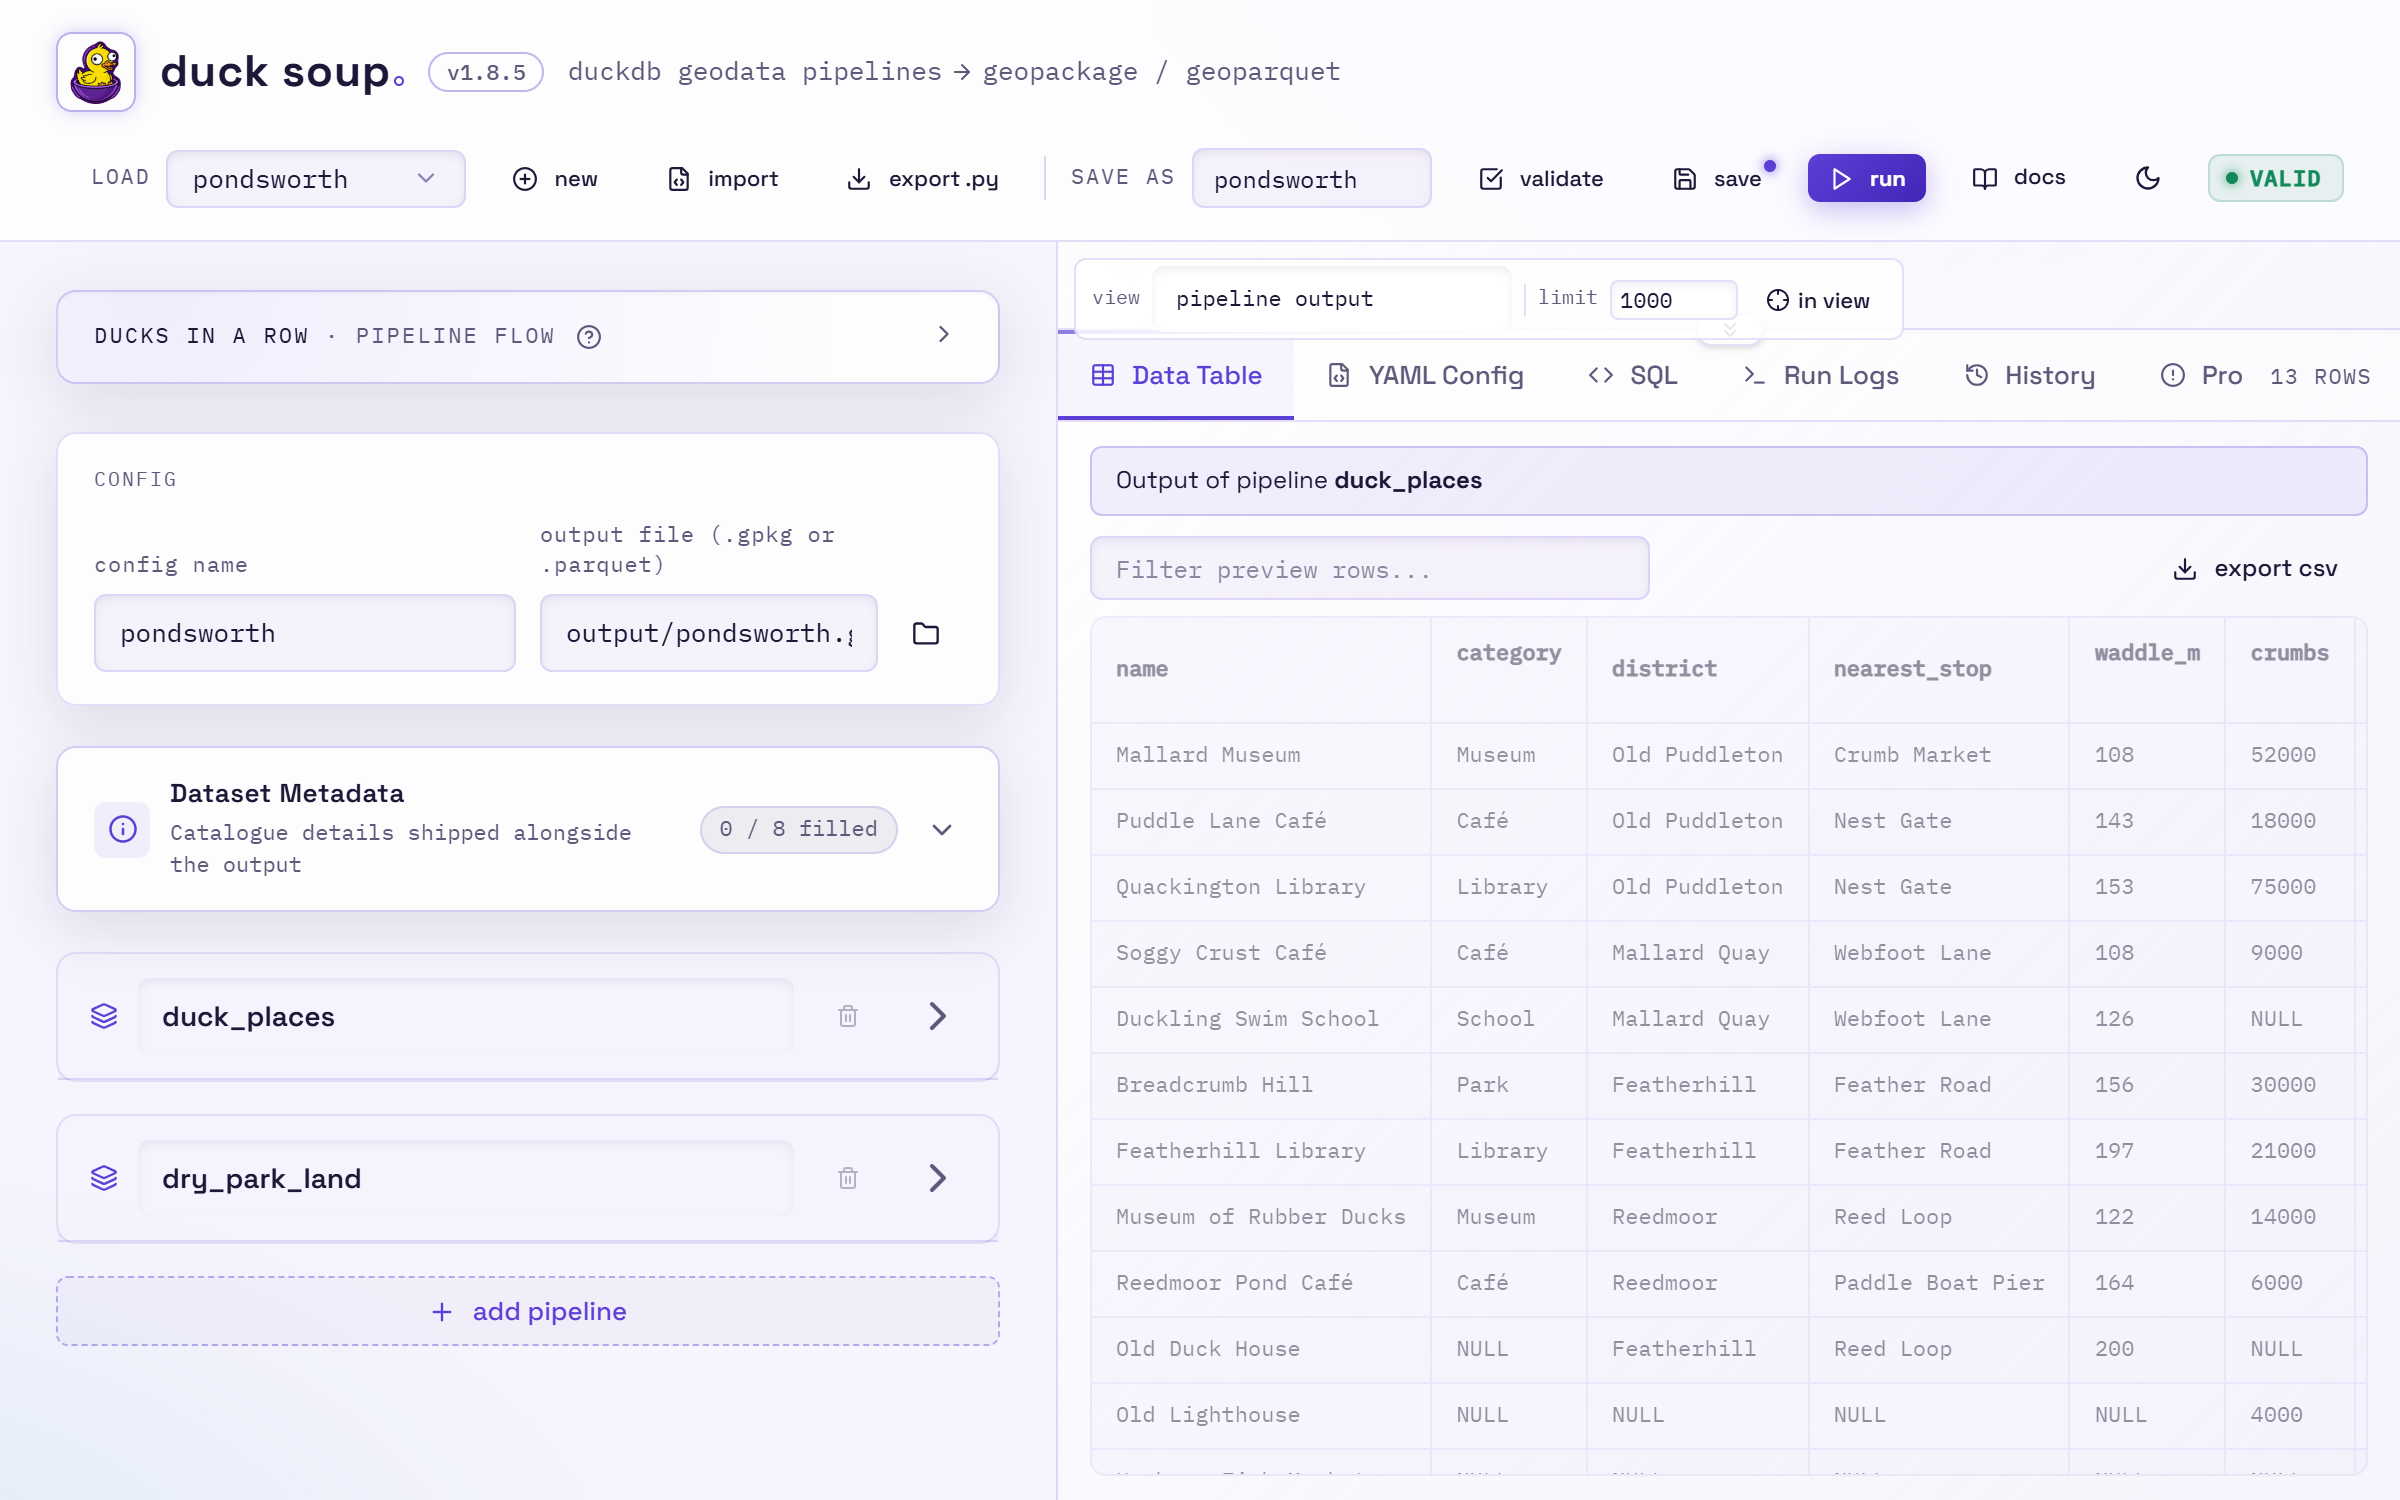
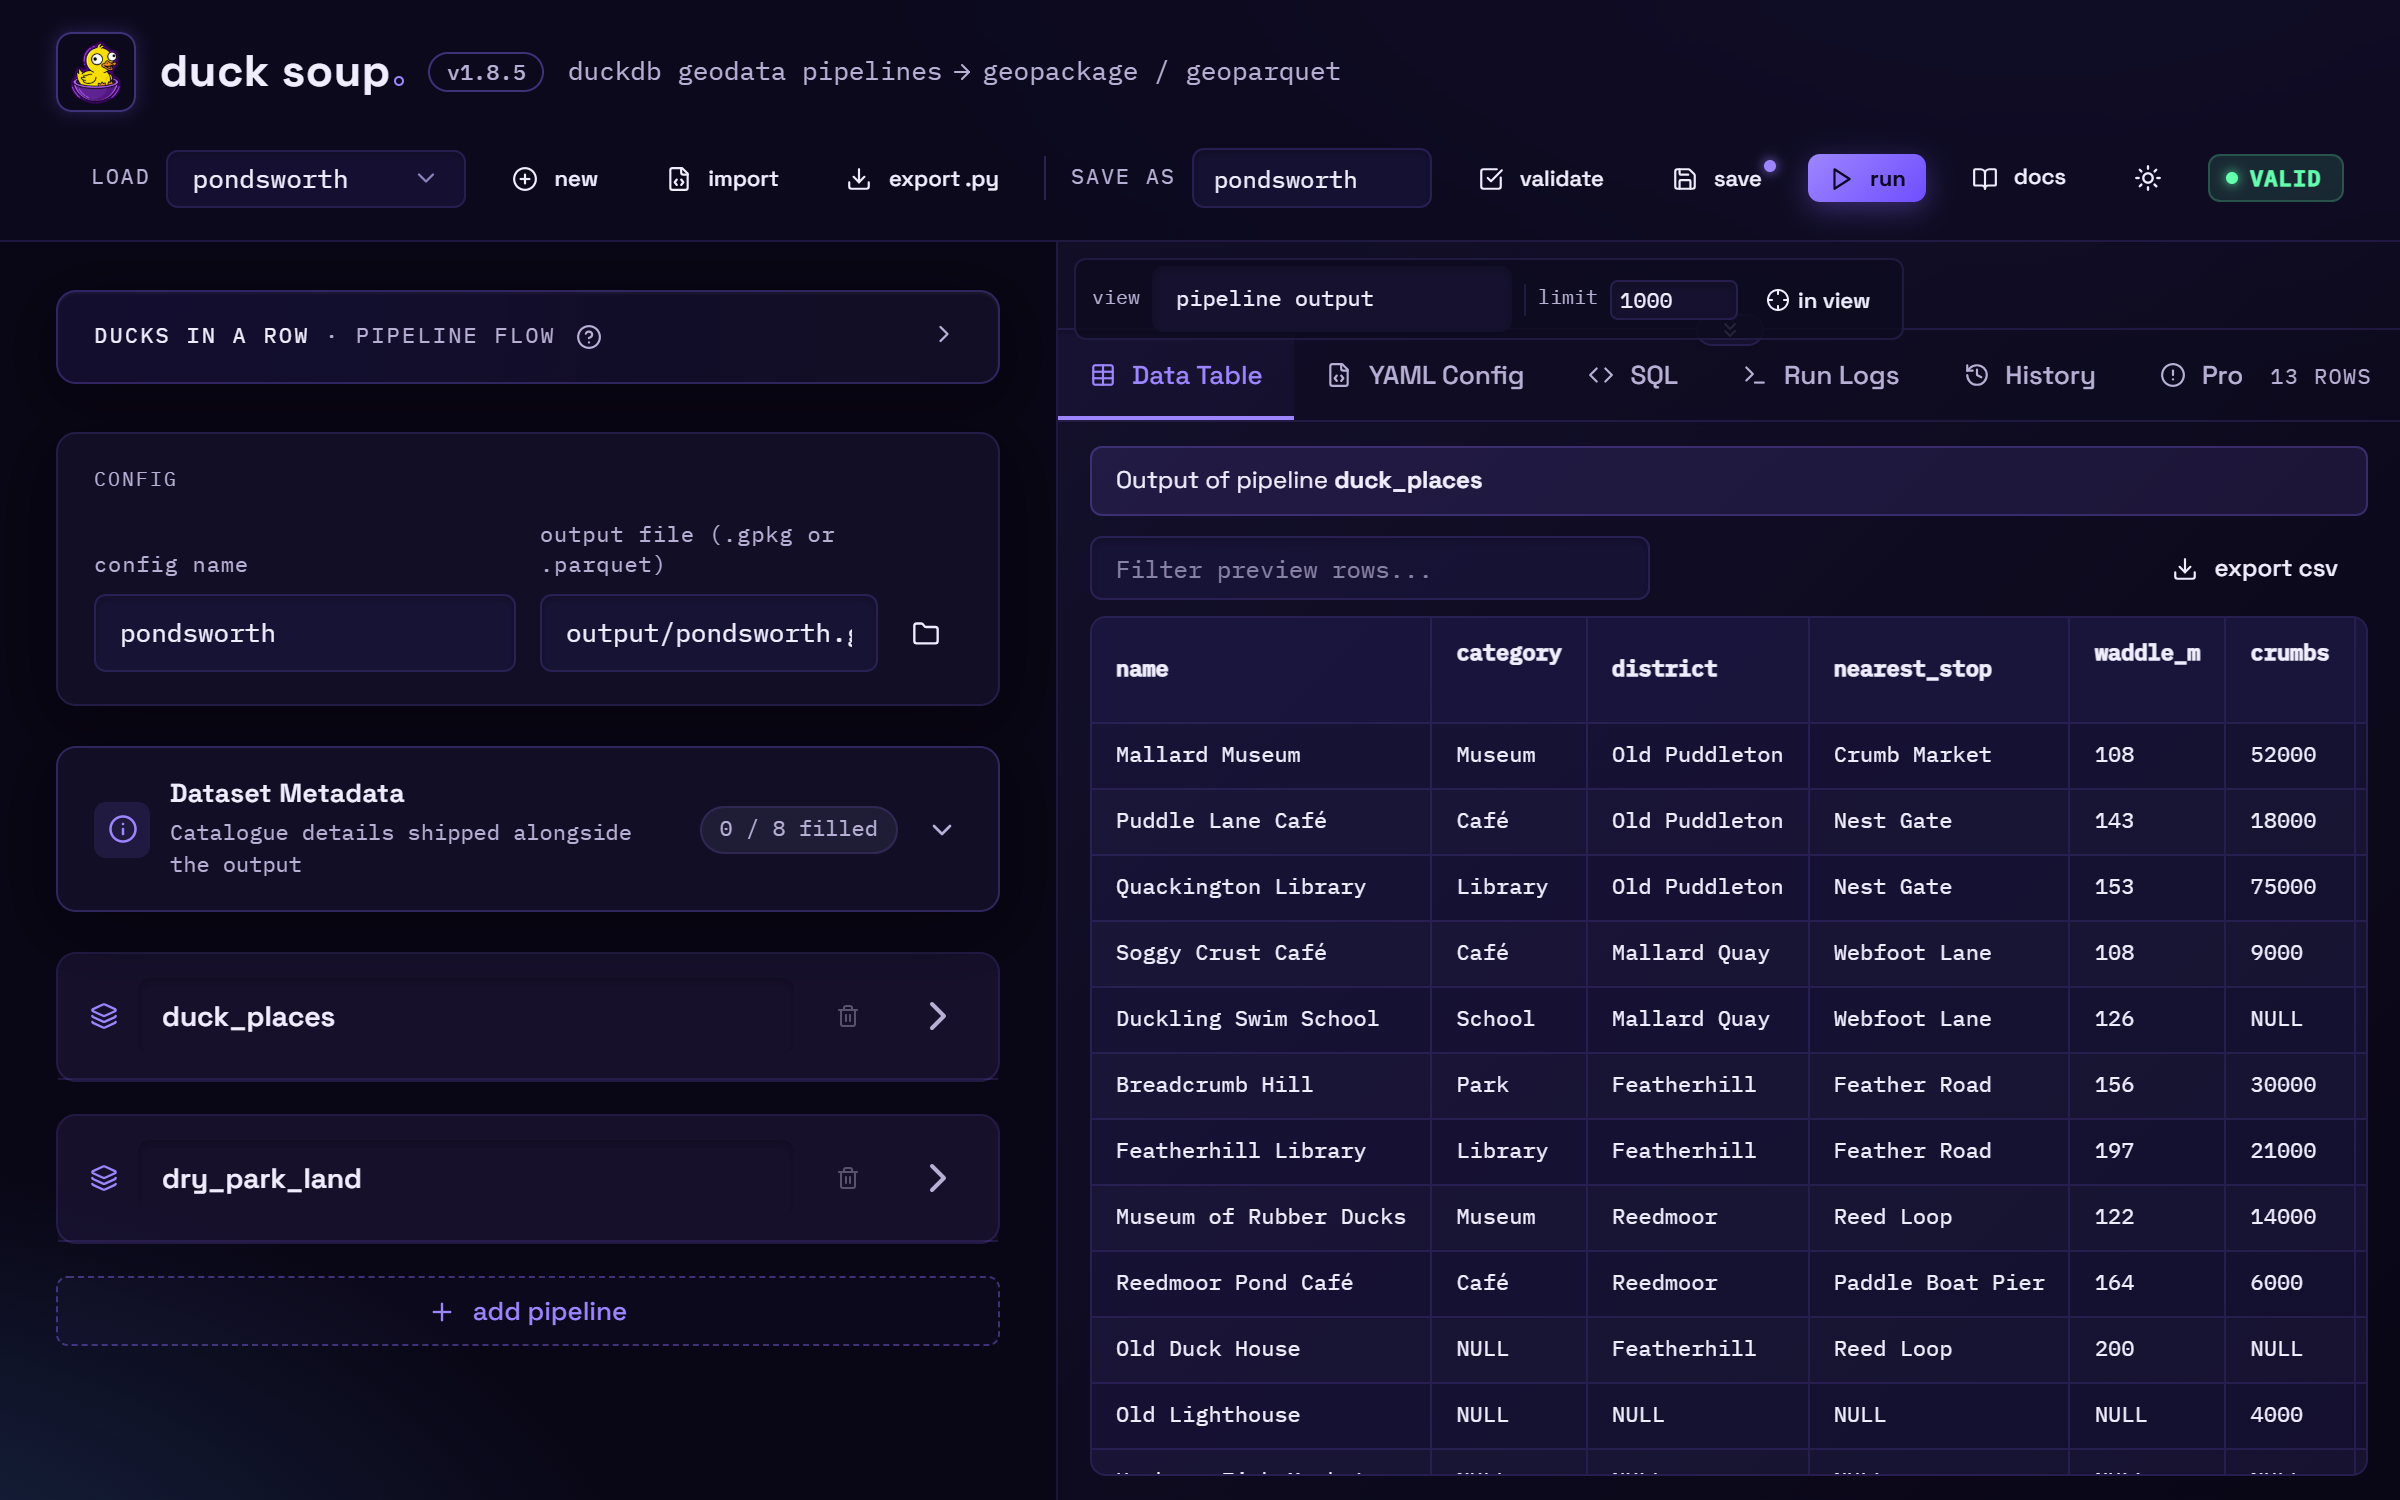
- Drag the line between the builder and the right-hand panel to make either side wider.
- Drag the line between the map and the tabs to give the map or the table more height.
- The small ⌃ tab in the middle of that line collapses the map to a thin strip. The toolbar stays visible, so view, limit and in view still work, and the table gets the full height. Click the button again, or drag the line down, to bring the map back.
- Double-click a dividing line to reset it. You can also focus a line with Tab and move it with the arrow keys.
The editor remembers the sizes in your browser. On narrow screens the panels stack vertically and the dividers are hidden.
Keyboard shortcuts
| Keys | Action |
|---|---|
| Ctrl+S | save |
| Ctrl+Enter | run |
| Ctrl+Shift+V | validate now |
| Ctrl+Z / Ctrl+Shift+Z | undo / redo a structural change |
| Alt+↑ / Alt+↓ | move the focused step or mapping row |
| Alt+← / Alt+→ | move the focused step node in the pipeline flow |
| Esc | close the editing panel |
| ← / → | switch tabs when a tab button has focus |
Use Cmd instead of Ctrl on macOS.
Undo/redo covers structural changes: adding, removing or reordering cards, auto-map, loading and starting new configs. Text you type in a field uses the browser's own undo inside that field.